CalibrationModel.com
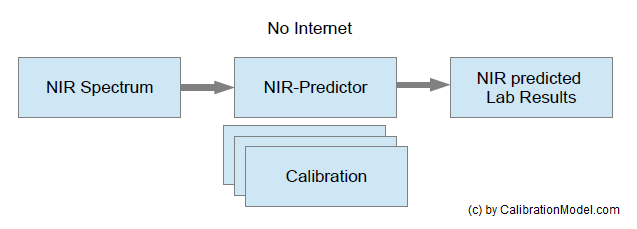
NIR User? Get better results faster | Food Science QC Lab Laboratory Manager chemist LabWork Chemie analytik LINKNIR-Predictor Software supports spectral file formats out of the box from: and others - Mobile spectroscopy NIRS portable Analyzers H2020 LINK
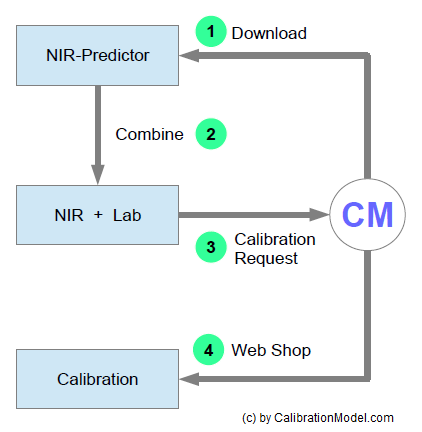
Timesaving Calibration Modeling Method: for near-infrared NIR Spectroscopy (NIRS) Multivariate Quantitative Prediction. food quality laboratory LINK
Spectroscopy and Chemometrics News Weekly 13, 2020 | NIRS NIR Spectroscopy MachineLearning Spectrometer Spectrometric Analytical Chemistry Chemical Analysis Lab Labs Laboratories Laboratory Software IoT Sensors QA QC Testing Quality LINK
Spektroskopie und Chemometrie Neuigkeiten Wöchentlich 13, 2020 | NIRS NIR Spektroskopie MachineLearning Spektrometer IoT Sensor Nahinfrarot Chemie Analytik Analysentechnik Analysemethode Nahinfrarotspektroskopie Laboranalyse analytic LINK
Spettroscopia e Chemiometria Weekly News 13, 2020 | NIRS NIR Spettroscopia MachineLearning analisi chimica Spettrale Spettrometro Chem IoT Sensore Attrezzatura analitica Laboratorio analisi prova qualità Analysesystem QualityControl LINK
We have updated the free NIR-Predictor-Software Spectral Data format support list for many mobile and benchtop NIR Spectroscopy Sensors. | Used in QualityControl for Food Fruits Milk Meat LINK
This week's NIR news Weekly is sponsored by Your-Company-Name-Here - NIR-spectrometers. Check out their product page ... link
Get the Chemometrics and Spectroscopy News in real time on Twitter @ CalibModel and follow us.
Near Infrared Spectroscopy (NIRS)
"Aplicação da espectroscopia de reflectância no infravermelho próximo (NIRS) na determinação do potencial bioquímico de metano–Revisão" LINK"Prediction of soil organic matter and clay contents by near-infrared spectroscopy-NIRS" LINK
"Fast detection and quantification of pork meat in other meats by reflectance FT-NIR spectroscopy and multivariate analysis" LINK
"Improved GA-SVM Algorithm and Its Application of NIR Spectroscopy in Orange Growing Location Identification" LINK
"Improved Deep CNN with Parameter Initialization for Data Analysis of Near-Infrared Spectroscopy Sensors." Tobacco LINK
"Data analysis on near infrared spectroscopy as a part of technology adoption for cocoa farmer in Aceh Province, Indonesia" LINK
"Improved Deep CNN with Parameter Initialization for Data Analysis of Near-Infrared Spectroscopy Sensors" LINK
"Identification of a Glass Substrate to Study Cells Using Fourier Transform Infrared Spectroscopy: Are We Closer to Spectral Pathology?" LINK
"Raman-Infrared spectral fusion combined with partial least squares (PLS) for quantitative analysis of polycyclic aromatic hydrocarbons in soil" LINK
"Identification metliod of ginger-processed Pinelliaternata based on infrared spectroscopy data fusion." LINK
"Terahertz Time of Flight Spectroscopy as a Coating Thickness Reference Method for Partial Least Squares Near Infrared Spectroscopy Models" LINK
"Quantitative detection of apple watercore and soluble solids content by near infrared transmittance spectroscopy" LINK
Hyperspectral
"Rapid Identification and Visualization of Jowl Meat Adulteration in Pork Using Hyperspectral Imaging." LINK"Hyperspectral monitoring of maize leaves under copper stress at different growth stages" LINK
"Classification of small-scale hyperspectral images with multi-source deep transfer learning" LINK
Chemometrics
"Detection of fat content in peanut kernels based on chemometrics and hyperspectral imaging technology" LINK"Hyperspectral Imaging Feature Selection Using Regression Tree Algorithm: Prediction of Carotenoid Content Velvet Apple Leaf" LINK
"Modelos de calibración para la cuantificación nutricional de praderas frescas mediante espectroscopía de infrarojo cercano" LINK
"Performance Evaluation of Chemometric Prediction Models—Key Components of Wheat Grain" LINK
Equipment
"Rapid Nondestructive Analysis of Intact Canola Seeds Using a Handheld NearInfrared Spectrometer" LINK"Confirmatory non-invasive and non-destructive differentiation between hemp and cannabis using a handheld Raman spectrometer" LINK
Process Control
"Monitoring of CO2 Absorption Solvent in Natural Gas Process Using Fourier Transform Near-Infrared Spectrometry" LINKEnvironment
"Comparing laboratory and airborne hyperspectral data for the estimation and mapping of topsoil organic carbon: Feature selection coupled with random forest" LINKAgriculture
"Predicting Forage Quality of Warm-Season Legumes by Near Infrared Spectroscopy Coupled with Machine Learning Techniques." LINK"Les défis de la technologie de l'aliment en nutrition volaille: pertinence et enjeux pour répondre aux attentes industrielles et sociétales" LINK
"CHANGES IN THE CONTENT OF STRUCTURAL CARBOHYDRATES AND LIGNIN IN THE BIOMASS OF Lolium multiflorum (Lam.) AFTER APPLYING SLURRY …" LINK
"Rapid Analysis of Alcohol Content During the Green Jujube Wine Fermentation by FT-NIR" LINK
"Spectral Analysis and Deconvolution of the Amide I Band of Proteins Presenting with High-Frequency Noise and Baseline Shifts" LINK
Petro
"Spectroscopic evidence of special intermolecular interaction in iodomethane-ethanol mixtures: the cooperative effect of halogen bonding, hydrogen bonding, and …" LINKPharma
"Defocused Spatially Offset Raman Spectroscopy in Media of Different Optical Properties for Biomedical Applications Using a Commercial Spatially Offset Raman Spectroscopy Device" LINKMedicinal
"A single oral dose of beetroot-based gel does not improve muscle oxygenation parameters, but speeds up handgrip isometric strength recovery in recreational combat …" LINKOther
"Spectral differentiation of oak wilt from foliar fungal disease and drought is correlated with physiological changes" LINK"Wearing a headset containing both electroencephalography (EEG) and near-infrared spectroscopy (NIRS) sensors, the user simply imagines moving either his right hand, left hand, tongue or feet - and ASIMO makes a corresponding movement. " BrainInterface LINK
KnowItAll Software / Spectral Libraries & ChemWindow are now part of Wiley Science Solutions. See press release: LINK
"The uses of near infra-red spectroscopy in postharvest decision support: A review" LINK
CalibrationModel.com
NIR User? Get better results faster | Food Science QC Lab Laboratory Manager chemist LabWork Chemie analytik LINKNIR-Predictor Software supports spectral file formats out of the box from: and others - Mobile spectroscopy NIRS portable Analyzers H2020 LINK
Timesaving Calibration Modeling Method: for near-infrared NIR Spectroscopy (NIRS) Multivariate Quantitative Prediction. food quality laboratory LINK
Spectroscopy and Chemometrics News Weekly 13, 2020 | NIRS NIR Spectroscopy MachineLearning Spectrometer Spectrometric Analytical Chemistry Chemical Analysis Lab Labs Laboratories Laboratory Software IoT Sensors QA QC Testing Quality LINK
Spektroskopie und Chemometrie Neuigkeiten Wöchentlich 13, 2020 | NIRS NIR Spektroskopie MachineLearning Spektrometer IoT Sensor Nahinfrarot Chemie Analytik Analysentechnik Analysemethode Nahinfrarotspektroskopie Laboranalyse analytic LINK
Spettroscopia e Chemiometria Weekly News 13, 2020 | NIRS NIR Spettroscopia MachineLearning analisi chimica Spettrale Spettrometro Chem IoT Sensore Attrezzatura analitica Laboratorio analisi prova qualità Analysesystem QualityControl LINK
We have updated the free NIR-Predictor-Software Spectral Data format support list for many mobile and benchtop NIR Spectroscopy Sensors. | Used in QualityControl for Food Fruits Milk Meat LINK
This week's NIR news Weekly is sponsored by Your-Company-Name-Here - NIR-spectrometers. Check out their product page ... link
Get the Chemometrics and Spectroscopy News in real time on Twitter @ CalibModel and follow us.
Near Infrared Spectroscopy (NIRS)
"Aplicação da espectroscopia de reflectância no infravermelho próximo (NIRS) na determinação do potencial bioquímico de metano–Revisão" LINK"Prediction of soil organic matter and clay contents by near-infrared spectroscopy-NIRS" LINK
"Fast detection and quantification of pork meat in other meats by reflectance FT-NIR spectroscopy and multivariate analysis" LINK
"Improved GA-SVM Algorithm and Its Application of NIR Spectroscopy in Orange Growing Location Identification" LINK
"Improved Deep CNN with Parameter Initialization for Data Analysis of Near-Infrared Spectroscopy Sensors." Tobacco LINK
"Data analysis on near infrared spectroscopy as a part of technology adoption for cocoa farmer in Aceh Province, Indonesia" LINK
"Improved Deep CNN with Parameter Initialization for Data Analysis of Near-Infrared Spectroscopy Sensors" LINK
"Identification of a Glass Substrate to Study Cells Using Fourier Transform Infrared Spectroscopy: Are We Closer to Spectral Pathology?" LINK
"Raman-Infrared spectral fusion combined with partial least squares (PLS) for quantitative analysis of polycyclic aromatic hydrocarbons in soil" LINK
"Identification metliod of ginger-processed Pinelliaternata based on infrared spectroscopy data fusion." LINK
"Terahertz Time of Flight Spectroscopy as a Coating Thickness Reference Method for Partial Least Squares Near Infrared Spectroscopy Models" LINK
"Quantitative detection of apple watercore and soluble solids content by near infrared transmittance spectroscopy" LINK
Hyperspectral
"Rapid Identification and Visualization of Jowl Meat Adulteration in Pork Using Hyperspectral Imaging." LINK"Hyperspectral monitoring of maize leaves under copper stress at different growth stages" LINK
"Classification of small-scale hyperspectral images with multi-source deep transfer learning" LINK
Chemometrics
"Detection of fat content in peanut kernels based on chemometrics and hyperspectral imaging technology" LINK"Hyperspectral Imaging Feature Selection Using Regression Tree Algorithm: Prediction of Carotenoid Content Velvet Apple Leaf" LINK
"Modelos de calibración para la cuantificación nutricional de praderas frescas mediante espectroscopía de infrarojo cercano" LINK
"Performance Evaluation of Chemometric Prediction Models—Key Components of Wheat Grain" LINK
Equipment
"Rapid Nondestructive Analysis of Intact Canola Seeds Using a Handheld NearInfrared Spectrometer" LINK"Confirmatory non-invasive and non-destructive differentiation between hemp and cannabis using a handheld Raman spectrometer" LINK
Process Control
"Monitoring of CO2 Absorption Solvent in Natural Gas Process Using Fourier Transform Near-Infrared Spectrometry" LINKEnvironment
"Comparing laboratory and airborne hyperspectral data for the estimation and mapping of topsoil organic carbon: Feature selection coupled with random forest" LINKAgriculture
"Predicting Forage Quality of Warm-Season Legumes by Near Infrared Spectroscopy Coupled with Machine Learning Techniques." LINK"Les défis de la technologie de l'aliment en nutrition volaille: pertinence et enjeux pour répondre aux attentes industrielles et sociétales" LINK
"CHANGES IN THE CONTENT OF STRUCTURAL CARBOHYDRATES AND LIGNIN IN THE BIOMASS OF Lolium multiflorum (Lam.) AFTER APPLYING SLURRY …" LINK
"Rapid Analysis of Alcohol Content During the Green Jujube Wine Fermentation by FT-NIR" LINK
"Spectral Analysis and Deconvolution of the Amide I Band of Proteins Presenting with High-Frequency Noise and Baseline Shifts" LINK
Petro
"Spectroscopic evidence of special intermolecular interaction in iodomethane-ethanol mixtures: the cooperative effect of halogen bonding, hydrogen bonding, and …" LINKPharma
"Defocused Spatially Offset Raman Spectroscopy in Media of Different Optical Properties for Biomedical Applications Using a Commercial Spatially Offset Raman Spectroscopy Device" LINKMedicinal
"A single oral dose of beetroot-based gel does not improve muscle oxygenation parameters, but speeds up handgrip isometric strength recovery in recreational combat …" LINKOther
"Spectral differentiation of oak wilt from foliar fungal disease and drought is correlated with physiological changes" LINK"Wearing a headset containing both electroencephalography (EEG) and near-infrared spectroscopy (NIRS) sensors, the user simply imagines moving either his right hand, left hand, tongue or feet - and ASIMO makes a corresponding movement. " BrainInterface LINK
KnowItAll Software / Spectral Libraries & ChemWindow are now part of Wiley Science Solutions. See press release: LINK
"The uses of near infra-red spectroscopy in postharvest decision support: A review" LINK