CalibrationModel.com
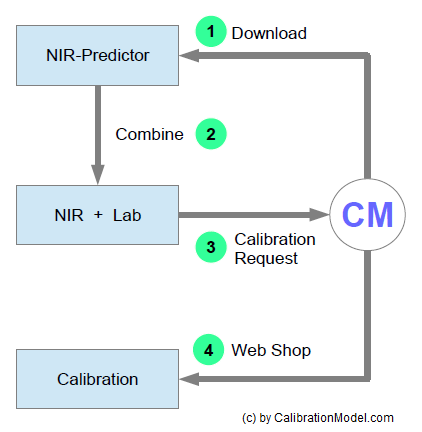
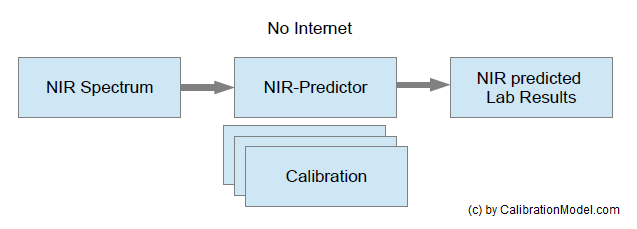
CalibrationModel.com has changed the pricing structure and NIRS-Calibration licensing options (including new perpetual and unlimited systems). | #NIR #Spectroscopy #Chemometric #AutoML #Calibration #Development #Service #milk #meet #food #qualitycontrol LINKDo you work with Near Infra-red Reflectance Spectrometry (NIRS) and need better Accuracy? NIR Spectroscopy | mill agriculture LINK
Spectroscopy and Chemometrics News Weekly 11, 2020 | NIRS NIR Spectroscopy MachineLearning Spectrometer Spectrometric Analytical foodprocessing foodsafety Analysis Lab Labs Laboratories Laboratory Software IoT Sensors Testing Quality LINK
Spektroskopie und Chemometrie Neuigkeiten Wöchentlich 11, 2020 | NIRS NIR Spektroskopie MachineLearning Spektrometer IoT Sensor nearinfrared Chemie Analytik Analysengeräte Analysentechnik Analysemethode Nahinfrarotspektroskopie Laboranalyse LINK
Spettroscopia e Chemiometria Weekly News 11, 2020 | NIRS NIR Spettroscopia MachineLearning analisi chimica Spettrale Spettrometro Chem IoT Sensore Attrezzatura analitica Laboratorio analisi prova qualità Analysesystem QualityControl LINK
Near Infrared
"Characterization of the Fruits and Seeds of Alpinia Oxyphylla Miq by High-Performance Liquid Chromatography (HPLC) and near-Infrared Spectroscopy (NIRS) with Partial Least …" LINK"Yenidoğan Yoğun Bakım Ünitesinde Yeni Bir Yaklaşım: Hemşirelik Bakımında Yakın Kızılötesi Spektroskopisi (Near-Infrared Spectroscopy-NIRS) Kullanımı" LINK
"Individual Wheat Kernels Vigor Assessment Based on NIR Spectroscopy Coupled with Machine Learning Methodologies" LINK
"Characteristion of Hydrogen Bond of L–Methionium Hydrogen Selenite by Temperature Dependent Two-dimensional Correlation FT-NIR Spectroscopy" LINK
"Authentication of Iberian pork official quality categories using a portable near infrared spectroscopy (NIRS) instrument." LINK
"Determination of grated hard cheeses adulteration by near infrared spectroscopy (NIR) and multivariate analysis" LINK
"Prekalibrasi Rumput Gajah Menggunakan NIRS dan Perbandingannya dengan Pengujian Kimia" LINK
"Near‐infrared spectroscopy (NIRS) for taxonomic entomology: A brief review" LINK
"NIR spectroscopy can detect acrylamide" Visible Spectrophotometer H2020 LINK
"Evaluation and classification of five cereal fungi on culture medium using Visible/Near-Infrared (Vis/NIR) hyperspectral imaging" LINK
"APLIKASI NEAR INFRARED SPECTROSCOPY (NIRS) UNTUK MENDETEKSI PENCEMARAN TANAH" LINK
"Near-Infrared Hyperspectral Imaging Combined with Deep Learning to Identify Cotton Seed Varieties." LINK
"Structural and visible-near infrared optical properties of (Fe, Mo)-co-doped TiO2 for colored cool pigments" LINK
"Rapid Evaluation of Biomass Properties Used for Energy Purposes Using Near-Infrared Spectroscopy" DOI: 10.5772/intechopen.90828 LINK
"Visible/near infrared spectroscopy and machine learning for predicting polyhydroxybutyrate production cultured on alkaline pretreated liquor from corn stover" LINK
"Kernel functions embedded in support vector machine learning models for rapid water pollution assessment via near-infrared spectroscopy." LINK
"Determination of the viability of retinispora (Hinoki cypress) seeds using shortwave infrared hyperspectral imaging spectroscopy" LINK
"PREDIKSI KADAR SALINITAS, PH DAN C-ORGANIK TANAH MENGGUNAKAN NEAR INFRARED KECAMATAN BAITUSSALAM KABUPATEN ACEH BESAR" LINK
"Determination of pH and acidity in green coffee by near infrared spectroscopy and multivariate regression" LINK
Chemometrics
"Prediction of soil properties with machine learning models based on the spectral response of soil samples in the near infrared range" LINKThe statistics mantra "Correlation does NOT mean Causation" explained with an example. LINK
"Evaluation of aroma styles in flue-cured tobacco by near infrared spectroscopy combined with chemometric algorithms" LINK
"Sensors, Vol. 20, Pages 686: Fuzzy Evaluation Output of Taste Information for Liquor Using Electronic Tongue Based on Cloud Model" LINK
"Modelos de calibración para la cuantificación nutricional de praderas frescas mediante espectroscopía de infrarojo cercano" LINK
"Determination of Total Phenolic Content and NIR-Chemometrics Classification Model of Queen and Local Varieties of Soursop (Annonamuricata L.) Leaf Powder" LINK
"Recognition of different Longjing fresh tea varieties using hyperspectral imaging technology and chemometrics" LINK
Facts
"Visualizing the History of Pandemics" #infoGrafics LINKEquipment
"Development of Low-Cost Portable Spectrometers for Detection of Wood Defects." LINKProcess Control
"Preparation of Celecoxib Tablet by Hot Melt Extrusion Technology and Application of Process Analysis Technology to Discriminate Solubilization Effect" LINK"Internet of Things — Leap towards a hyper-connected world" IoT Spectral Sensors SpectralSensing qualitycontrol analysis Production ProcessControl foodprocessing foodsafety foodproduction AI BigData DataScience #INFOGRAPHICS LINK
Agriculture
"Estimating fatty acid content and related nutritional indexes in ewe milk using different near infrared instruments" LINK"Indirect measures of methane emissions of Sahelian zebu cattle in West Africa, role of environment and management" LINK
"Detection of mycotoxins and toxigenic fungi in cereal grains using vibrational spectroscopic techniques: a review" LINK
"NIR spectroscopy and management of bioactive components, antioxidant activity, and macronutrients in fruits" LINK
"Scald-Cold: Joint Austrian-Italian consortium in the Euregio project for the comprehensive dissection of the superficial scald in apples" postharvest food LINK
"Both genetic and environmental conditions affect wheat grain texture: Consequences for grain fractionation and flour properties" LINK
"A phenotyping tool for water status determination in soybean by vegetation indexes and NIR-SWIR spectral bands." LINK
Pharma
"Non-destructive dose verification of two drugs within 3D printed polyprintlets" LINKLaboratory
"Forward and Backward Interval Partial Least Squares Method for Quantitative Analysis of Frying Oil Quality" LINKOther
"Study of simple detection of gasoline fuel contaminants contributing to increase Particulate Matter Emissions" LINK"COVID-19 Open Research Dataset (CORD-19)" LINK
.
CalibrationModel.com
CalibrationModel.com has changed the pricing structure and NIRS-Calibration licensing options (including new perpetual and unlimited systems). | #NIR #Spectroscopy #Chemometric #AutoML #Calibration #Development #Service #milk #meet #food #qualitycontrol LINKDo you work with Near Infra-red Reflectance Spectrometry (NIRS) and need better Accuracy? NIR Spectroscopy | mill agriculture LINK
Spectroscopy and Chemometrics News Weekly 11, 2020 | NIRS NIR Spectroscopy MachineLearning Spectrometer Spectrometric Analytical foodprocessing foodsafety Analysis Lab Labs Laboratories Laboratory Software IoT Sensors Testing Quality LINK
Spektroskopie und Chemometrie Neuigkeiten Wöchentlich 11, 2020 | NIRS NIR Spektroskopie MachineLearning Spektrometer IoT Sensor nearinfrared Chemie Analytik Analysengeräte Analysentechnik Analysemethode Nahinfrarotspektroskopie Laboranalyse LINK
Spettroscopia e Chemiometria Weekly News 11, 2020 | NIRS NIR Spettroscopia MachineLearning analisi chimica Spettrale Spettrometro Chem IoT Sensore Attrezzatura analitica Laboratorio analisi prova qualità Analysesystem QualityControl LINK
Near Infrared
"Characterization of the Fruits and Seeds of Alpinia Oxyphylla Miq by High-Performance Liquid Chromatography (HPLC) and near-Infrared Spectroscopy (NIRS) with Partial Least …" LINK"Yenidoğan Yoğun Bakım Ünitesinde Yeni Bir Yaklaşım: Hemşirelik Bakımında Yakın Kızılötesi Spektroskopisi (Near-Infrared Spectroscopy-NIRS) Kullanımı" LINK
"Individual Wheat Kernels Vigor Assessment Based on NIR Spectroscopy Coupled with Machine Learning Methodologies" LINK
"Characteristion of Hydrogen Bond of L–Methionium Hydrogen Selenite by Temperature Dependent Two-dimensional Correlation FT-NIR Spectroscopy" LINK
"Authentication of Iberian pork official quality categories using a portable near infrared spectroscopy (NIRS) instrument." LINK
"Determination of grated hard cheeses adulteration by near infrared spectroscopy (NIR) and multivariate analysis" LINK
"Prekalibrasi Rumput Gajah Menggunakan NIRS dan Perbandingannya dengan Pengujian Kimia" LINK
"Near‐infrared spectroscopy (NIRS) for taxonomic entomology: A brief review" LINK
"NIR spectroscopy can detect acrylamide" Visible Spectrophotometer H2020 LINK
"Evaluation and classification of five cereal fungi on culture medium using Visible/Near-Infrared (Vis/NIR) hyperspectral imaging" LINK
"APLIKASI NEAR INFRARED SPECTROSCOPY (NIRS) UNTUK MENDETEKSI PENCEMARAN TANAH" LINK
"Near-Infrared Hyperspectral Imaging Combined with Deep Learning to Identify Cotton Seed Varieties." LINK
"Structural and visible-near infrared optical properties of (Fe, Mo)-co-doped TiO2 for colored cool pigments" LINK
"Rapid Evaluation of Biomass Properties Used for Energy Purposes Using Near-Infrared Spectroscopy" DOI: 10.5772/intechopen.90828 LINK
"Visible/near infrared spectroscopy and machine learning for predicting polyhydroxybutyrate production cultured on alkaline pretreated liquor from corn stover" LINK
"Kernel functions embedded in support vector machine learning models for rapid water pollution assessment via near-infrared spectroscopy." LINK
"Determination of the viability of retinispora (Hinoki cypress) seeds using shortwave infrared hyperspectral imaging spectroscopy" LINK
"PREDIKSI KADAR SALINITAS, PH DAN C-ORGANIK TANAH MENGGUNAKAN NEAR INFRARED KECAMATAN BAITUSSALAM KABUPATEN ACEH BESAR" LINK
"Determination of pH and acidity in green coffee by near infrared spectroscopy and multivariate regression" LINK
Chemometrics
"Prediction of soil properties with machine learning models based on the spectral response of soil samples in the near infrared range" LINKThe statistics mantra "Correlation does NOT mean Causation" explained with an example. LINK
"Evaluation of aroma styles in flue-cured tobacco by near infrared spectroscopy combined with chemometric algorithms" LINK
"Sensors, Vol. 20, Pages 686: Fuzzy Evaluation Output of Taste Information for Liquor Using Electronic Tongue Based on Cloud Model" LINK
"Modelos de calibración para la cuantificación nutricional de praderas frescas mediante espectroscopía de infrarojo cercano" LINK
"Determination of Total Phenolic Content and NIR-Chemometrics Classification Model of Queen and Local Varieties of Soursop (Annonamuricata L.) Leaf Powder" LINK
"Recognition of different Longjing fresh tea varieties using hyperspectral imaging technology and chemometrics" LINK
Facts
"Visualizing the History of Pandemics" #infoGrafics LINKEquipment
"Development of Low-Cost Portable Spectrometers for Detection of Wood Defects." LINKProcess Control
"Preparation of Celecoxib Tablet by Hot Melt Extrusion Technology and Application of Process Analysis Technology to Discriminate Solubilization Effect" LINK"Internet of Things — Leap towards a hyper-connected world" IoT Spectral Sensors SpectralSensing qualitycontrol analysis Production ProcessControl foodprocessing foodsafety foodproduction AI BigData DataScience #INFOGRAPHICS LINK
Agriculture
"Estimating fatty acid content and related nutritional indexes in ewe milk using different near infrared instruments" LINK"Indirect measures of methane emissions of Sahelian zebu cattle in West Africa, role of environment and management" LINK
"Detection of mycotoxins and toxigenic fungi in cereal grains using vibrational spectroscopic techniques: a review" LINK
"NIR spectroscopy and management of bioactive components, antioxidant activity, and macronutrients in fruits" LINK
"Scald-Cold: Joint Austrian-Italian consortium in the Euregio project for the comprehensive dissection of the superficial scald in apples" postharvest food LINK
"Both genetic and environmental conditions affect wheat grain texture: Consequences for grain fractionation and flour properties" LINK
"A phenotyping tool for water status determination in soybean by vegetation indexes and NIR-SWIR spectral bands." LINK
Pharma
"Non-destructive dose verification of two drugs within 3D printed polyprintlets" LINKLaboratory
"Forward and Backward Interval Partial Least Squares Method for Quantitative Analysis of Frying Oil Quality" LINKOther
"Study of simple detection of gasoline fuel contaminants contributing to increase Particulate Matter Emissions" LINK"COVID-19 Open Research Dataset (CORD-19)" LINK