That is common practice. But is this good practice?
And nobody asks, how long, how hard have you tried, how many trial have you done, if this really the best model that is possible from the data?
And imagine the cost of the data collection including the lab analytics!
And behind this costs, have you really tried hard enough to get the best out of your data? Was the calibration done quick and dirty on a Friday afternoon? Yes, time is limited and manually clicking around and wait in such kind of software is not really fun, so what are the consequences?
Now I come to the most important core point ever, if you own expensive NIR spectrometer system, or even many of them, and your company has collected a lot of NIR spectra and expensive Lab-reference data over years, do you spend just a few hours to develop and build that model, that will define the whole system's measurement performance for the future? And ask yourself again (and your boss will ask you later), have you really tried hard enough, to get the best out of your data? really?
What else is possible? What does your competition do?
There is no measure (yet) what can be reached with a specific NIR data set.
And this is very interesting, because there are different beliefs if a secondary method like NIR or Raman can be more precise and accurate, as the primary method.
What we do different is, that our highly specialized software is capable of creating large amounts of useful calibrations to investigate this limits – what is possible. It's done by permutation and combination of spectra-selection, wave-selection, pre-processing sequences and PC selections. If you are common with this, then you know that the possibilities are huge.
For a pre-screening, we create e.g. 42'000 useful calibrations for the mentioned data set. With useful we mean that the model is usable, e.g. R² is higher than 0.8, which shows a good correlation between the spectra and the constituent and it is well fitted (neither over-fitted nor under-fitted) because the PC selection for the calibration-set is estimated by the validation-set and the predictive performance of the test-set is used for model comparisons.
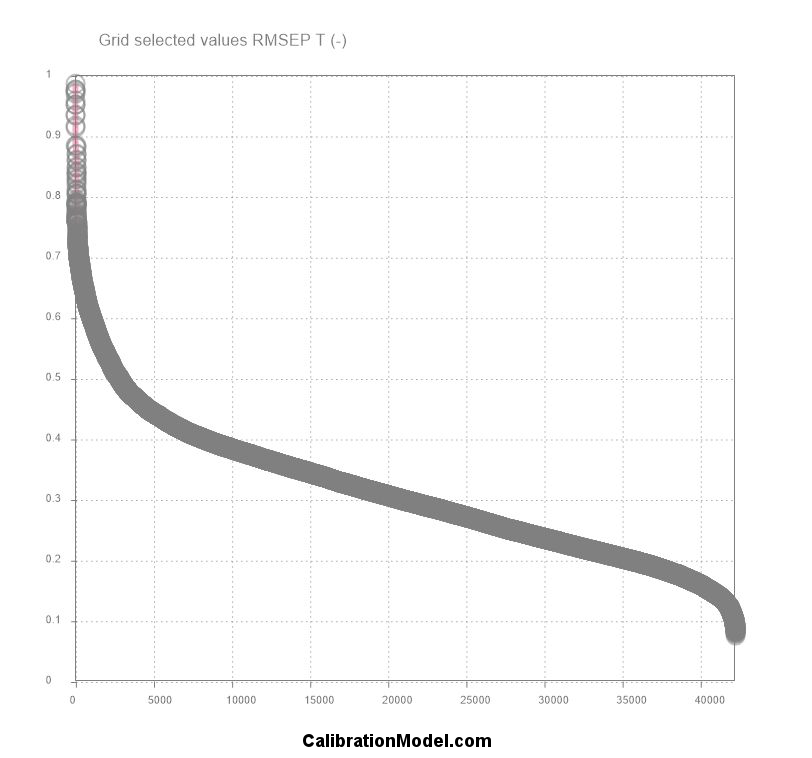
Here the sorted RMSEP values of the Test Set is shown for 42'000 calibrations.
You can immediately see that the manually found performance of 0.49 is just in the starting phase of our optimization. Interesting is the steep fall from 1.0 to 0.5 where manually optimization found it's solutions. A range where ca. 2500 different useful calibrations exist. The following less steep fall from 0.5 to 0.2 contains a lot more useful models and between 0.2 to 0.08 the obvious high accurate models are around 2500 different ones. So the golden needle is not in the first 2500 models, it must be somewhere in the last 2500 models in the haystack.
That allows us to pick the best calibration out of 42'000 models, depending on multiple statistical evaluation criteria, that is not just the R² or RPD, SEC, SEP or RMSEP, (or Akaike Information Criterion (AIC), Bayesian Information Criterion (BIC), Multivariate AIC (MAIC) etc.) we do the model selection based on multiple statistical parameters.
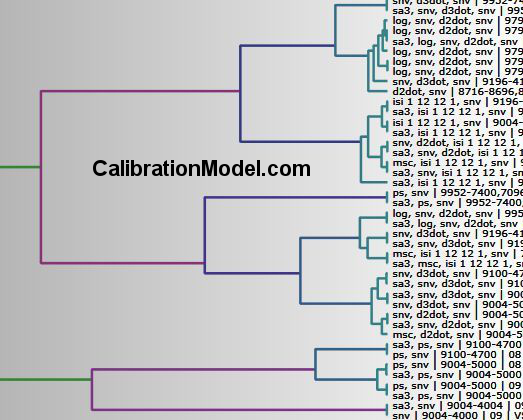
To compare the calibration models by similarity it is best viewed with dendrogram plots like this (zoomed in), where the settings are shown versus the models overall performance similarity. In the settings you can see a lot of different permutations of pre-processings combined with different wave-selections.
To give you an insight what we do to find the optimal model, imagine a NIR data set, where a NIR specialist works hard for 4 hours in his chemometric software to try what he can with his chemometric-, NIR spectroscopic- and his product-knowledge to get a good model. During the 4 hours he finds 3 final candidate models for his application. With the RMSEP of 0.49 , 0.51 and 0.6. Now he has to choose one or to test all his three models on new measured NIR spectra.
That is common practice. But is this good practice?
And nobody asks, how long, how hard have you tried, how many trial have you done, if this really the best model that is possible from the data?
And imagine the cost of the data collection including the lab analytics!
And behind this costs, have you really tried hard enough to get the best out of your data? Was the calibration done quick and dirty on a Friday afternoon? Yes, time is limited and manually clicking around and wait in such kind of software is not really fun, so what are the consequences?
Now I come to the most important core point ever, if you own expensive NIR spectrometer system, or even many of them, and your company has collected a lot of NIR spectra and expensive Lab-reference data over years, do you spend just a few hours to develop and build that model, that will define the whole system's measurement performance for the future? And ask yourself again (and your boss will ask you later), have you really tried hard enough, to get the best out of your data? really?
What else is possible? What does your competition do?
There is no measure (yet) what can be reached with a specific NIR data set.
And this is very interesting, because there are different beliefs if a secondary method like NIR or Raman can be more precise and accurate, as the primary method.
What we do different is, that our highly specialized software is capable of creating large amounts of useful calibrations to investigate this limits – what is possible. It's done by permutation and combination of spectra-selection, wave-selection, pre-processing sequences and PC selections. If you are common with this, then you know that the possibilities are huge.
For a pre-screening, we create e.g. 42'000 useful calibrations for the mentioned data set. With useful we mean that the model is usable, e.g. R² is higher than 0.8, which shows a good correlation between the spectra and the constituent and it is well fitted (neither over-fitted nor under-fitted) because the PC selection for the calibration-set is estimated by the validation-set and the predictive performance of the test-set is used for model comparisons.
Here the sorted RMSEP values of the Test Set is shown for 42'000 calibrations.
You can immediately see that the manually found performance of 0.49 is just in the starting phase of our optimization. Interesting is the steep fall from 1.0 to 0.5 where manually optimization found it's solutions. A range where ca. 2500 different useful calibrations exist. The following less steep fall from 0.5 to 0.2 contains a lot more useful models and between 0.2 to 0.08 the obvious high accurate models are around 2500 different ones. So the golden needle is not in the first 2500 models, it must be somewhere in the last 2500 models in the haystack.
That allows us to pick the best calibration out of 42'000 models, depending on multiple statistical evaluation criteria, that is not just the R² or RPD, SEC, SEP or RMSEP, (or Akaike Information Criterion (AIC), Bayesian Information Criterion (BIC), Multivariate AIC (MAIC) etc.) we do the model selection based on multiple statistical parameters.
To compare the calibration models by similarity it is best viewed with dendrogram plots like this (zoomed in), where the settings are shown versus the models overall performance similarity. In the settings you can see a lot of different permutations of pre-processings combined with different wave-selections.