When you send your quantitative NIR spectra data to our NIR Calibration Model Service, you get a detailed calibration report (calibration protocol) of the found optimal calibration settings, so you are able to see all insights (ISO 12099) and easily capable to re-build the model in your NIR/Chemometric software.
Here is a part of our calibration report, that exactly describes the data used in the calibration set (CSet), the validation set (VSet) and the test set (TSet). The numbers are the number ids of the spectra in your delivered NIR data file.
The calibration method settings and parameters are
Waveselection : the variable selection or wavenumber selection or wavelength selection
Pretreatments : the spectral data pre-processing
PCs : the number of Principal Components (PC) or Latent Variables (LV)
Method : the modeling method algorithm used, e.g. PLS
Then the statistical analysis of the PLS model by the different sets (CSet, VSet, Tset).
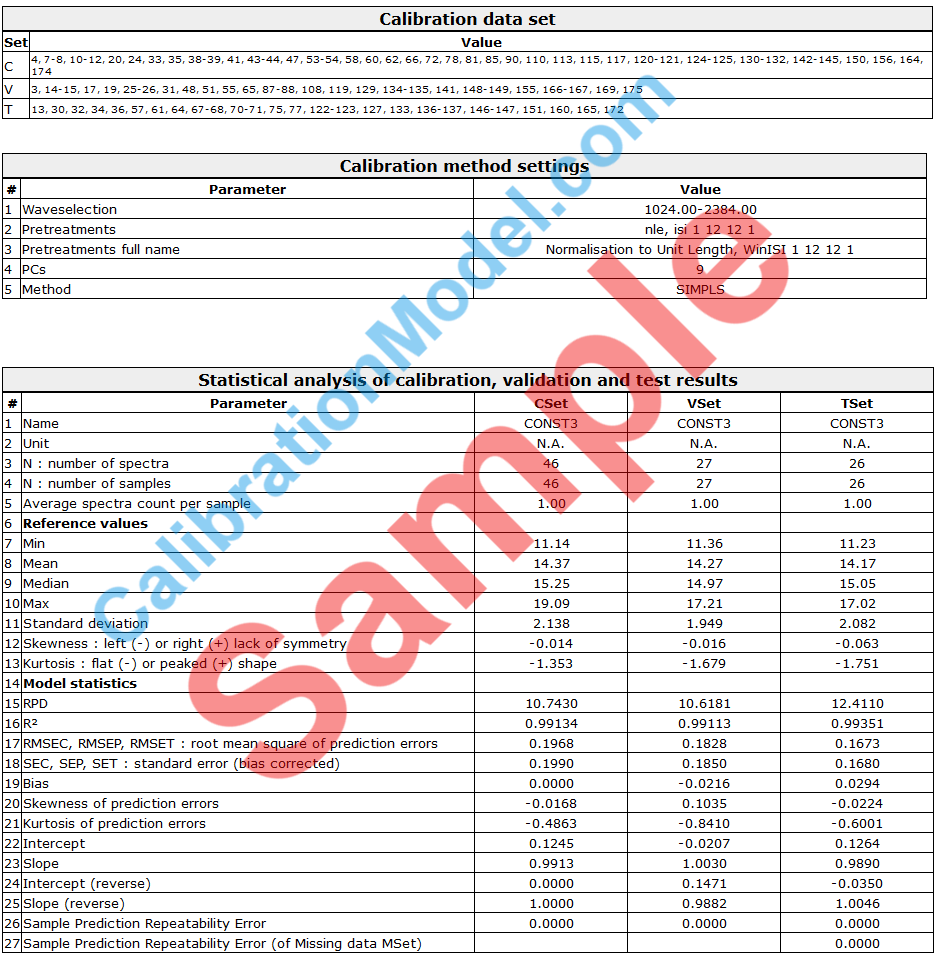
Statistical analysis of calibration, validation and test results : 1 Name, 2 Unit, 3 N : number of spectra, 4 N : number of samples, 5 Average spectra count per sample, 6 Reference values, 7 Min, 8 Mean, 9 Median, 10 Max, 11 Standard deviation, 12 Skewness : left (-) or right (+) lack of symmetry, 13 Kurtosis : flat (-) or peaked (+) shape, 14 Model statistics, 15 RPD, 16 R², 17 RMSEC, RMSEP, RMSET : root mean square of prediction errors, 18 SEC, SEP, SET : standard error (bias corrected), 19 Bias, 20 Skewness of prediction errors, 21 Kurtosis of prediction errors, 22 Intercept, 23 Slope, 24 Intercept (reverse), 25 Slope (reverse), 26 Sample Prediction Repeatability Error, 27 Sample Prediction Repeatability Error (of Missing data MSet)
This shows how we deliver the optimal settings. With the statistical values, the NIR model predicted values of all spectra and additional plots you are able to compare with your re-built model to verify that the models perform nearly equally.
Your Calibration Report including all calibration-, validation- and test statistics and plots can be downloaded from our Web-Shop after processing of your Calibration Request.