Get the Spectroscopy and Chemometrics News Weekly in real time on Twitter @ CalibModel and follow us.
NIR Calibration-Model Services
Spectroscopy and Chemometrics News Weekly 13, 2023 | Spectroscopy LINK
Spektroskopie und Chemometrie Neuigkeiten Wöchentlich 13, 2023 | Spektroskopie LINK
Spettroscopia e Chemiometria Weekly News 13, 2023 | Spettroscopia LINK
Near-Infrared Spectroscopy (NIRS)
“Reliability of Near-Infrared Spectroscopy with and without Compression Tights during Exercise and Recovery Activities” LINK
“Application of iterative distance correlation and PLS for wavelength interval selection in near infrared spectroscopy” LINK
“Geographical Origin Identification of Chinese Tomatoes Using Long-Wave Fourier-Transform Near-Infrared Spectroscopy Combined with Deep Learning Methods” | LINK
“Compositional indication of E-and M-type asteroids by VIS-NIR reflectance spectra of meteorites” LINK
“Portable near-infrared spectroscopy: a rapid and accurate blood test for diagnosis of Haemonchus contortus infection and for targeted selective treatment of sheep” | LINK
“Comparison of feed tables, empirical models and near-infrared spectroscopy to predict chemical composition and net energy of pelleted pig feeds” LINK
“… multi-position general model for evaluation of watercore and soluble solid content in ‘Fuji’apples using on-line full-transmittance visible and near infrared spectroscopy” LINK
“Diagnosis of Testicular Torsion and Differentiation from Other Pathologies Using Near-Infrared Spectroscopy” LINK
Raman Spectroscopy
“Foods : Identification of Illicit Conservation Treatments in Fresh Fish by Micro-Raman Spectroscopy and Chemometric Methods” | LINK
“Biosensors : Silver Nanostar-Based SERS for the Discrimination of Clinically Relevant Acinetobacter baumannii and Klebsiella pneumoniae Species and Clones” LINK
Hyperspectral Imaging (HSI)
“A Synthetic Hyperspectral Array Video Database with Applications to Cross-Spectral Reconstruction and Hyperspectral Video Coding” LINK
“Non-destructive detection of Tieguanyin adulteration based on fluorescence hyperspectral technique” | LINK
“Towards operational atmospheric correction of airborne hyperspectral imaging spectroscopy: Algorithm evaluation, key parameter analysis, and machine learning …” | LINK
“Study on Black Spot Disease Detection and Pathogenic Process Visualization on Winter Jujubes Using Hyperspectral Imaging System” LINK
“Agriculture : Evaluation of Aspergillus flavus Growth and Detection of Aflatoxin B1 Content on Maize Agar Culture Medium Using Vis/NIR Hyperspectral Imaging” | LINK
“A novel hyperspectral camera based on a Fourier-transform approach” LINK
“Abundance Matrix Correlation Analysis Network Based on Hierarchical Multi-Head Self-Cross-Hybrid Attention for Hyperspectral Change Detection” LINK
Chemometrics and Machine Learning
“Foods : Insight into the Recent Application of Chemometrics in Quality Analysis and Characterization of Bee Honey during Processing and Storage” | LINK
“Dual-sPLS: a family of Dual Sparse Partial Least Squares regressions for feature selection and prediction with tunable sparsity; evaluation on simulated and near-infrared (NIR) data. LINK
Research on Spectroscopy
” On the Unusual Temperature Dependence of Kaolinite Intercalation Capacity for N-methylformamide” | LINK
Equipment for Spectroscopy
“Analysis of alkaloids and reducing sugars in processed and unprocessed tobacco leaves using a handheld near infrared spectrometer” LINK
“Foods : Characterizing Spray-Dried Powders through NIR Spectroscopy: Effect of Two Preparation Strategies for Calibration Samples and Comparison of Two Types of NIR Spectrometers” | LINK
Environment NIR-Spectroscopy Application
“Legacy Effect of Long-Term Rice-Crab Co-Culture on N2o Emissions in Paddy Soils” LINK
Agriculture NIR-Spectroscopy Usage
“Plants : Spectral-Based Classification of Genetically Differentiated Groups in Spring Wheat Grown under Contrasting Environments” | LINK
“Formulation, optimization of a poultry feed and analysis of spectrometry, biochemical composition and energy facts” LINK
Horticulture NIR-Spectroscopy Applications
“Is this pear sweeter than this apple? A universal SSC model for fruits with similar physicochemical properties” | LINK
“Sensors : Estimation of Sugar Content in Wine Grapes via In Situ VNIR-SWIR Point Spectroscopy Using Explainable Artificial Intelligence Techniques” | LINK
Medicinal Spectroscopy
“Coherent Spontaneous Hemodynamics in the Human Brain” LINK
Other
“Zerebrale Protektion und Kanülierungstechniken im Rahmen der Aortenbogenchirurgie” | LINK
“Detailed analysis of termination kinetics in radical polymerization” LINK
“Near infrared spectroscopy for estimating properties of kraft paper reinforced with cellulose nanofibrils” LINK
“Effect of Atorvastatin on Microcirculation Evaluated by Vascular Occlusion Test with Peripheral Near-Infrared Spectroscopy” | LINK
“Foods : Quality Evaluation of Fair-Trade Cocoa Beans from Different Origins Using Portable Near-Infrared Spectroscopy (NIRS)” LINK
“Visible and near-infrared spectroscopy and deep learning application for the qualitative and quantitative investigation of nitrogen status in cotton leaves” | LINK
“HYPERSPECTRAL CAMERA BASED ON NEAR-INFRARED SINGLE-PIXEL IMAGING” LINK
“Implementazione di una applicazione della spettrometria del vicino infrarosso (NIRS) per il controllo del melasso di canna” LINK
“Effects of Different Optical Properties of Head Tissues on Near-Infrared Spectroscopy Using Monte Carlo Simulations” | LINK
“The role of near-infrared reflectance imaging in retinal disease: A systematic review” | LINK
“Determination of pitaya quality using portable NIR spectroscopy and innovative low-cost electronic nose” | LINK
“Effect of solution supersaturation on crystal formation of Vitamin K2 based on near infrared spectroscopy analysis technology” LINK
“Releasing fast and slow: Non-destructive prediction of density and drug release from SLS 3D printed tablets using NIR spectroscopy” LINK
“Estimation of Proximate, Fatty Acid, Mineral Content and Proline Level in Amaranth using Near Infrared Reflectance Spectroscopy” LINK
“Rapid Determination of Phosphogypsum in Soil Based by Infrared (IR) and Near-Infrared (NIR) Spectroscopy with Multivariate Calibration” | LINK
“Foods : Rapid Screening of High-Yield Gellan Gum Mutants of Sphingomonas paucimobilis ATCC 31461 by Combining Atmospheric and Room Temperature Plasma Mutation with Near-Infrared Spectroscopy Monitoring” LINK
Infrared Spectroscopy (IR) and Near-Infrared Spectroscopy (NIR)
“Quantitative and convenient protocol for analysis of surface‐modified silica nanoparticles using 29Si‐NMR and near‐infrared diffuse reflection spectroscopy” LINK
Hyperspectral Imaging (HSI)
“Sparse reproducible machine learning for near infrared hyperspectral imaging: Estimating the tetrahydrocannabinolic acid concentration in Cannabis sativa L.” | LINK
“Non-destructive prediction of yak meat freshness indicator by hyperspectral techniques in the oxidation process” LINK
“Foods : Effect of Moisture Content Difference on the Analysis of Quality Attributes of Red Pepper (Capsicum annuum L.) Powder Using a Hyperspectral System” | LINK
Chemometrics and Machine Learning
“The Predicted Model of the Sensory Quality of Refrigerated Tilapia Skin Established Based on Characteristic Near-Infrared Spectrum” LINK
“Remote Sensing : A Method for Retrieving Cloud-Top Height Based on a Machine Learning Model Using the Himawari-8 Combined with Near Infrared Data” | LINK
“Foods : Bayesian Fusion Model Enhanced Codfish Classification Using Near Infrared and Raman Spectrum” | LINK
Research on Spectroscopy
“Basil essential oil product formulation by paste encapsulation method for reducing pre-and post-harvest losses of mango” LINK
Equipment for Spectroscopy
“Oxyhaemoglobin Level Measured Using Near-Infrared Spectrometer Is Associated with Brain Mitochondrial Dysfunction After Cardiac Arrest in Rats” | LINK
Environment NIR-Spectroscopy Application
“Stormwater biofilter response to high nitrogen loading under transient flow conditions: ammonium and nitrate fates, and nitrous oxide emissions” LINK
Agriculture NIR-Spectroscopy Usage
“Agronomy : Rapid Nondestructive Detection of Chlorophyll Content in Muskmelon Leaves under Different Light Quality Treatments” | LINK
“Agriculture : Combining Multitemporal Sentinel-2A Spectral Imaging and Random Forest to Improve the Accuracy of Soil Organic Matter Estimates in the Plough Layer for Cultivated Land” LINK
“Assessing the sensitive spectral bands for soybean water status monitoring and soil moisture prediction using leaf-based hyperspectral reflectance” LINK
Horticulture NIR-Spectroscopy Applications
“Comparative Study of Carotenoids Content in Ripe and Unripe Oil Palm Fresh Fruit Bunches” LINK
Other
“Perceived Exertion Correlates with Multiple Physiological Parameters During Cardiopulmonary Exercise Testing” | LINK
“FUMANTES SINTOMÁTICOS SEM DPOC COM SUSPEITA DE DOENÇA MICROVASCULAR PULMONAR ASSOCIADA AO TABACO E TRATAMENTO COM …” LINK
“Sample size for the physical and physico-chemical characteristics of the cashew” LINK
This week's NIR news Weekly is sponsored by Your-Company-Name-Here - NIR-spectrometers. Check out their product page ... link
Get the Spectroscopy and Chemometrics News Weekly in real time on Twitter @ CalibModel and follow us.
Near-Infrared Spectroscopy (NIRS)
"Insight into the stability of protein in confined environment through analyzing the structure of water by temperature-dependent near-infrared spectroscopy" LINK
"Determination of starch and amylose contents in various cereals using common model of near-infrared reflectance spectroscopy." LINK
"RESEARCH ARTICLE Near-infrared spectroscopy for the distinction of wood and charcoal from Fabaceae species: comparison of ANN, KNN AND SVM ..." LINK
"Device-Independent Discrimination of Falsified Amoxicillin Capsules Using Heterogeneous Near-Infrared Spectroscopic Devices for Training and Testing of a Support Vector Machine" LINK
"High quality VO(2) thin films synthesized from V(2)O(5) powder for sensitive near-infrared detection" | LINK
"Detection of toxic chemicals in hand sanitizers using near-infrared spectroscopy" LINK
"Identification of Baha'sib mung beans based on Fourier transform near infrared spectroscopy and partial least squares" LINK
"Remote Sensing : Identification of Amaranthus Species Using Visible-Near-Infrared (Vis-NIR) Spectroscopy and Machine Learning Methods" LINK
"Nondestructive Detection of Internal Flavor in 'Shatian'Pomelo Fruit Based on Visible/Near Infrared Spectroscopy" | LINK
"Determination of sex-enhancing drugs illegally added in health care products by TLC-NIRS combined technology" LINK
"Rapid detection of exogenous sucrose in black tea samples based on near-infrared spectroscopy" LINK
"Rapid determination of diesel fuel properties by near-infrared spectroscopy" LINK
"Biosensors : Room-Temperature Synthesis of Air-Stable Near-Infrared Emission in FAPbI3 Nanoparticles Embedded in Silica" LINK
"Potential of visible-near infrared spectroscopy for the determination of three soil aggregate stability indices" LINK
" A dataset of the chemical composition and near-infrared spectroscopy measurements of raw cattle, poultry and pig manure" LINK
"Forests : Identifying Wood Based on Near-Infrared Spectra and Four Gray-Level Co-Occurrence Matrix Texture Features" LINK
"... Selection for Referenceless Multivariate Calibration: A Case Study on Nicotine Determination in Flue-Cured Tobacco Powder by Near-Infrared (NIR) Spectroscopy" LINK
"Prediction and Utilization of Malondialdehyde in Exotic Pine Under Drought Stress Using Near-Infrared Spectroscopy" | LINK
"Quantification of irrigated lesion morphology using near-infrared spectroscopy" | LINK
"A Comparison between the Post-and Pre-dispersive Near Infrared Spectroscopy in Non-Destructive Brix Prediction Using Artificial Neural Network" LINK
Infrared Spectroscopy (IR) and Near-Infrared Spectroscopy (NIR)
"Efficient Broadband Near‐Infrared Emission in the GaTaO4:Cr3+ Phosphor" | LINK
"Aflatoxin contaminated cocoa beans classification using near-infrared spectroscopy" LINK
"The Effect Of Hemodynamic Parameters On Peripheral Near Infrared Spectroscopy In An Animal Model" LINK
"Iridium(III) Complexes with [2, 1, 0] Charged Ligands Realized DeepRed/NearInfrared Phosphorescent Emission" LINK
Raman Spectroscopy
"Multivariate Analysis Aided Surface-Enhanced Raman Spectroscopy (MVA-SERS) Multiplex Quantitative Detection of Trace Fentanyl in Illicit Drug Mixtures Using a Handheld Raman Spectrometer" LINK
Hyperspectral Imaging (HSI)
"BRCN-ERN: A Bidirectional Reconstruction Coding Network and Enhanced Residual Network for Hyperspectral Change Detection" LINK
"Rapid identification of adulterated safflower seed oil by use of hyperspectral spectroscopy" LINK
"Remote Sensing : Monitoring the Severity of Pantana phyllostachysae Chao on Bamboo Using Leaf Hyperspectral Data" LINK
"Rapid identification of the green tea geographical origin and processing month based on near-infrared hyperspectral imaging combined with chemometrics" LINK
"Chemometric strategies for near infrared hyperspectral imaging analysis: classification of cotton seed genotypes" LINK
"Applied Sciences : Determination of Sugar, pH, and Anthocyanin Contents in Port Wine Grape Berries through Hyperspectral Imaging: An Extensive Comparison of Linear and Non-Linear Predictive Methods" LINK
"... Area Index, Chlorophyll Content and Fraction of Vegetation Cover Using an Empirical-Statistical Approach from Chris-Proba Satellite Hyperspectral Images over the ..." LINK
"Design and verification of a large-field hyperspectral imaging system" LINK
"Visualization of heavy metal cadmium in lettuce leaves based on wavelet support vector machine regression model and visible‐near infrared hyperspectral imaging" LINK
"Band Selection for HSI Classification using Binary Constrained Optimization" LINK
"New Approach to the Old Challenge of Free Flap Monitoring—Hyperspectral Imaging Outperforms Clinical Assessment by Earlier Detection of Perfusion Failure" LINK
Spectral Imaging
"Machine learning and hyper spectral imaging: multi spectral endoscopy in the gastro intestinal tract towards hyper spectral endoscopy" LINK
Chemometrics and Machine Learning
"... residual extreme learning machine (PLSRR-ELM) calibration algorithm applied in fast determination of gasoline octane number with near-infrared spectroscopy" LINK
"Recognition of authentic or false blood based on NIR spectroscopy and PCA-WNN-PSO algorithm" LINK
"EVALUATION OF AGARWOOD (AQUILARIA MALACCENIS) FROM BINTAN ISLAND BASED ON INDONESIAN STANDARD: PREDICTING ITS QUALITY USING ..." LINK
"Comparison of PLS and SVM models for soil organic matter and particle size using vis-NIR spectral libraries" LINK
"Multivariate Calibration of Concentrations of C, Mn, Si, Cr, Ni, and Cu in Low-Alloy Steels from Raw Low-Resolution Spectra Obtained By Laser-Induced Breakdown Spectroscopy" LINK
Optics for Spectroscopy
"Foam Flows in Turbulent Liquid Exfoliation of Layered Materials and Implications for Graphene Production and Inline Characterisation" LINK
"Chemical Engineering of Cu-Sn Disordered Network Metamaterials" LINK
"High-Performance Waveguide-Integrated Bi<sub>2</sub>O<sub>2</sub>Se Photodetector for Si Photonic Integrated Circuits" LINK
Equipment for Spectroscopy
"Electrical and Mechanical Properties of Intrinsically Flexible and Stretchable PEDOT Polymers for Thermotherapy" LINK
"Application of hand-held near-infrared and Raman spectrometers in surface treatment authentication of cork stoppers" LINK
Process Control and NIR Sensors
"Dry Powder Mixing Is Feasible in Continuous Twin Screw Extruder: Towards Lean Extrusion Process for Oral Solid Dosage Manufacturing" | LINK
"Manipulating electroluminochromism behavior of viologen substituted iridium(III) complexes through ligand engineering for information display and encryption" LINK
Environment NIR-Spectroscopy Application
"Remote Sensing : Estimating Vertical Distribution of Leaf Water Content within Wheat Canopies after Head Emergence" LINK
Agriculture NIR-Spectroscopy Usage
"Towards ecological intensification of agriculture: from management to soil bacterial and nitrogen-cycling communities" LINK
"Er: YAG Laser Cleaning of Painted Surfaces: Functional Considerations to Improve Efficacy and Reduce Side Effects" LINK
"Agronomy : Evaluation of Metabolomic Profile and Growth of Moringa oleifera L. Cultivated with Vermicompost under Different Soil Types" LINK
"High-throughput phenotyping of cool-season crops using non-invasive sensing techniques" LINK
Forestry and Wood Industry NIR Usage
"Polymers : Passive Fire Protection of Taeda pine Wood by Using Starch-Based Surface Coatings" LINK
Food & Feed Industry NIR Usage
"Foods : Microbiological Quality Assessment of Chicken Thigh Fillets Using Spectroscopic Sensors and Multivariate Data Analysis" LINK
"The potential to increase beef production in tropical Nth Australia by including Desmanthus cv JCU 2 in a Buffel grass (Cenchrus ciliaris) dominant pasture" LINK
Pharma Industry NIR Usage
"Spectroscopic characteristics of Xeloda chemodrug" | LINK
Laboratory and NIR-Spectroscopy
"Potential of laboratory hyperspectral data for in-field detection of Phytophthora infestans on potato" LINK
Other
"Beam test of carbon ion production for development of new compact ECR ion source for multi ion therapy" LINK
"Silver Peroxide Nanoparticles for Combined Antibacterial Sonodynamic and Photothermal Therapy" | LINK
"Splanchnic oxygen saturation during reoxygenation with 21% or 100% O2 in newborn piglets" | LINK
NIR Calibration-Model Services
Effective development of new quantitative prediction equations for multivariate data like NIR spectra | spectrum LINK
How to improve calibration models for NIR Instrument Devices? Wheat Food Security LINK
Spectroscopy and Chemometrics News Weekly 48, 2021 | NIRS NIR Spectroscopy MachineLearning Spectrometer Spectrometric Analytical Chemistry Chemical Analysis Lab Labs Laboratories Laboratory Software IoT Sensors QA QC Testing Quality LINK
This week's NIR news Weekly is sponsored by Your-Company-Name-Here - NIR-spectrometers. Check out their product page ... link
Get the Spectroscopy and Chemometrics News Weekly in real time on Twitter @ CalibModel and follow us.
Near-Infrared Spectroscopy (NIRS)
"Insight into the stability of protein in confined environment through analyzing the structure of water by temperature-dependent near-infrared spectroscopy" LINK
"Determination of starch and amylose contents in various cereals using common model of near-infrared reflectance spectroscopy." LINK
"RESEARCH ARTICLE Near-infrared spectroscopy for the distinction of wood and charcoal from Fabaceae species: comparison of ANN, KNN AND SVM ..." LINK
"Device-Independent Discrimination of Falsified Amoxicillin Capsules Using Heterogeneous Near-Infrared Spectroscopic Devices for Training and Testing of a Support Vector Machine" LINK
"High quality VO(2) thin films synthesized from V(2)O(5) powder for sensitive near-infrared detection" | LINK
"Detection of toxic chemicals in hand sanitizers using near-infrared spectroscopy" LINK
"Identification of Baha'sib mung beans based on Fourier transform near infrared spectroscopy and partial least squares" LINK
"Remote Sensing : Identification of Amaranthus Species Using Visible-Near-Infrared (Vis-NIR) Spectroscopy and Machine Learning Methods" LINK
"Nondestructive Detection of Internal Flavor in 'Shatian'Pomelo Fruit Based on Visible/Near Infrared Spectroscopy" | LINK
"Determination of sex-enhancing drugs illegally added in health care products by TLC-NIRS combined technology" LINK
"Rapid detection of exogenous sucrose in black tea samples based on near-infrared spectroscopy" LINK
"Rapid determination of diesel fuel properties by near-infrared spectroscopy" LINK
"Biosensors : Room-Temperature Synthesis of Air-Stable Near-Infrared Emission in FAPbI3 Nanoparticles Embedded in Silica" LINK
"Potential of visible-near infrared spectroscopy for the determination of three soil aggregate stability indices" LINK
" A dataset of the chemical composition and near-infrared spectroscopy measurements of raw cattle, poultry and pig manure" LINK
"Forests : Identifying Wood Based on Near-Infrared Spectra and Four Gray-Level Co-Occurrence Matrix Texture Features" LINK
"... Selection for Referenceless Multivariate Calibration: A Case Study on Nicotine Determination in Flue-Cured Tobacco Powder by Near-Infrared (NIR) Spectroscopy" LINK
"Prediction and Utilization of Malondialdehyde in Exotic Pine Under Drought Stress Using Near-Infrared Spectroscopy" | LINK
"Quantification of irrigated lesion morphology using near-infrared spectroscopy" | LINK
"A Comparison between the Post-and Pre-dispersive Near Infrared Spectroscopy in Non-Destructive Brix Prediction Using Artificial Neural Network" LINK
Infrared Spectroscopy (IR) and Near-Infrared Spectroscopy (NIR)
"Efficient Broadband Near‐Infrared Emission in the GaTaO4:Cr3+ Phosphor" | LINK
"Aflatoxin contaminated cocoa beans classification using near-infrared spectroscopy" LINK
"The Effect Of Hemodynamic Parameters On Peripheral Near Infrared Spectroscopy In An Animal Model" LINK
"Iridium(III) Complexes with [2, 1, 0] Charged Ligands Realized DeepRed/NearInfrared Phosphorescent Emission" LINK
Raman Spectroscopy
"Multivariate Analysis Aided Surface-Enhanced Raman Spectroscopy (MVA-SERS) Multiplex Quantitative Detection of Trace Fentanyl in Illicit Drug Mixtures Using a Handheld Raman Spectrometer" LINK
Hyperspectral Imaging (HSI)
"BRCN-ERN: A Bidirectional Reconstruction Coding Network and Enhanced Residual Network for Hyperspectral Change Detection" LINK
"Rapid identification of adulterated safflower seed oil by use of hyperspectral spectroscopy" LINK
"Remote Sensing : Monitoring the Severity of Pantana phyllostachysae Chao on Bamboo Using Leaf Hyperspectral Data" LINK
"Rapid identification of the green tea geographical origin and processing month based on near-infrared hyperspectral imaging combined with chemometrics" LINK
"Chemometric strategies for near infrared hyperspectral imaging analysis: classification of cotton seed genotypes" LINK
"Applied Sciences : Determination of Sugar, pH, and Anthocyanin Contents in Port Wine Grape Berries through Hyperspectral Imaging: An Extensive Comparison of Linear and Non-Linear Predictive Methods" LINK
"... Area Index, Chlorophyll Content and Fraction of Vegetation Cover Using an Empirical-Statistical Approach from Chris-Proba Satellite Hyperspectral Images over the ..." LINK
"Design and verification of a large-field hyperspectral imaging system" LINK
"Visualization of heavy metal cadmium in lettuce leaves based on wavelet support vector machine regression model and visible‐near infrared hyperspectral imaging" LINK
"Band Selection for HSI Classification using Binary Constrained Optimization" LINK
"New Approach to the Old Challenge of Free Flap Monitoring—Hyperspectral Imaging Outperforms Clinical Assessment by Earlier Detection of Perfusion Failure" LINK
Spectral Imaging
"Machine learning and hyper spectral imaging: multi spectral endoscopy in the gastro intestinal tract towards hyper spectral endoscopy" LINK
Chemometrics and Machine Learning
"... residual extreme learning machine (PLSRR-ELM) calibration algorithm applied in fast determination of gasoline octane number with near-infrared spectroscopy" LINK
"Recognition of authentic or false blood based on NIR spectroscopy and PCA-WNN-PSO algorithm" LINK
"EVALUATION OF AGARWOOD (AQUILARIA MALACCENIS) FROM BINTAN ISLAND BASED ON INDONESIAN STANDARD: PREDICTING ITS QUALITY USING ..." LINK
"Comparison of PLS and SVM models for soil organic matter and particle size using vis-NIR spectral libraries" LINK
"Multivariate Calibration of Concentrations of C, Mn, Si, Cr, Ni, and Cu in Low-Alloy Steels from Raw Low-Resolution Spectra Obtained By Laser-Induced Breakdown Spectroscopy" LINK
Optics for Spectroscopy
"Foam Flows in Turbulent Liquid Exfoliation of Layered Materials and Implications for Graphene Production and Inline Characterisation" LINK
"Chemical Engineering of Cu-Sn Disordered Network Metamaterials" LINK
"High-Performance Waveguide-Integrated Bi<sub>2</sub>O<sub>2</sub>Se Photodetector for Si Photonic Integrated Circuits" LINK
Equipment for Spectroscopy
"Electrical and Mechanical Properties of Intrinsically Flexible and Stretchable PEDOT Polymers for Thermotherapy" LINK
"Application of hand-held near-infrared and Raman spectrometers in surface treatment authentication of cork stoppers" LINK
Process Control and NIR Sensors
"Dry Powder Mixing Is Feasible in Continuous Twin Screw Extruder: Towards Lean Extrusion Process for Oral Solid Dosage Manufacturing" | LINK
"Manipulating electroluminochromism behavior of viologen substituted iridium(III) complexes through ligand engineering for information display and encryption" LINK
Environment NIR-Spectroscopy Application
"Remote Sensing : Estimating Vertical Distribution of Leaf Water Content within Wheat Canopies after Head Emergence" LINK
Agriculture NIR-Spectroscopy Usage
"Towards ecological intensification of agriculture: from management to soil bacterial and nitrogen-cycling communities" LINK
"Er: YAG Laser Cleaning of Painted Surfaces: Functional Considerations to Improve Efficacy and Reduce Side Effects" LINK
"Agronomy : Evaluation of Metabolomic Profile and Growth of Moringa oleifera L. Cultivated with Vermicompost under Different Soil Types" LINK
"High-throughput phenotyping of cool-season crops using non-invasive sensing techniques" LINK
Forestry and Wood Industry NIR Usage
"Polymers : Passive Fire Protection of Taeda pine Wood by Using Starch-Based Surface Coatings" LINK
Food & Feed Industry NIR Usage
"Foods : Microbiological Quality Assessment of Chicken Thigh Fillets Using Spectroscopic Sensors and Multivariate Data Analysis" LINK
"The potential to increase beef production in tropical Nth Australia by including Desmanthus cv JCU 2 in a Buffel grass (Cenchrus ciliaris) dominant pasture" LINK
Pharma Industry NIR Usage
"Spectroscopic characteristics of Xeloda chemodrug" | LINK
Laboratory and NIR-Spectroscopy
"Potential of laboratory hyperspectral data for in-field detection of Phytophthora infestans on potato" LINK
Other
"Beam test of carbon ion production for development of new compact ECR ion source for multi ion therapy" LINK
"Silver Peroxide Nanoparticles for Combined Antibacterial Sonodynamic and Photothermal Therapy" | LINK
"Splanchnic oxygen saturation during reoxygenation with 21% or 100% O2 in newborn piglets" | LINK

NIR Calibration-Model Services
Effective development of new quantitative prediction equations for multivariate data like NIR spectra | spectrum LINK
How to improve calibration models for NIR Instrument Devices? Wheat Food Security LINK
Spectroscopy and Chemometrics News Weekly 48, 2021 | NIRS NIR Spectroscopy MachineLearning Spectrometer Spectrometric Analytical Chemistry Chemical Analysis Lab Labs Laboratories Laboratory Software IoT Sensors QA QC Testing Quality LINK
This week's NIR news Weekly is sponsored by Your-Company-Name-Here - NIR-spectrometers. Check out their product page ... link
Get the Spectroscopy and Chemometrics News Weekly in real time on Twitter @ CalibModel and follow us.
Near-Infrared Spectroscopy (NIRS)
"Insight into the stability of protein in confined environment through analyzing the structure of water by temperature-dependent near-infrared spectroscopy" LINK
"Determination of starch and amylose contents in various cereals using common model of near-infrared reflectance spectroscopy." LINK
"RESEARCH ARTICLE Near-infrared spectroscopy for the distinction of wood and charcoal from Fabaceae species: comparison of ANN, KNN AND SVM ..." LINK
"Device-Independent Discrimination of Falsified Amoxicillin Capsules Using Heterogeneous Near-Infrared Spectroscopic Devices for Training and Testing of a Support Vector Machine" LINK
"High quality VO(2) thin films synthesized from V(2)O(5) powder for sensitive near-infrared detection" | LINK
"Detection of toxic chemicals in hand sanitizers using near-infrared spectroscopy" LINK
"Identification of Baha'sib mung beans based on Fourier transform near infrared spectroscopy and partial least squares" LINK
"Remote Sensing : Identification of Amaranthus Species Using Visible-Near-Infrared (Vis-NIR) Spectroscopy and Machine Learning Methods" LINK
"Nondestructive Detection of Internal Flavor in 'Shatian'Pomelo Fruit Based on Visible/Near Infrared Spectroscopy" | LINK
"Determination of sex-enhancing drugs illegally added in health care products by TLC-NIRS combined technology" LINK
"Rapid detection of exogenous sucrose in black tea samples based on near-infrared spectroscopy" LINK
"Rapid determination of diesel fuel properties by near-infrared spectroscopy" LINK
"Biosensors : Room-Temperature Synthesis of Air-Stable Near-Infrared Emission in FAPbI3 Nanoparticles Embedded in Silica" LINK
"Potential of visible-near infrared spectroscopy for the determination of three soil aggregate stability indices" LINK
" A dataset of the chemical composition and near-infrared spectroscopy measurements of raw cattle, poultry and pig manure" LINK
"Forests : Identifying Wood Based on Near-Infrared Spectra and Four Gray-Level Co-Occurrence Matrix Texture Features" LINK
"... Selection for Referenceless Multivariate Calibration: A Case Study on Nicotine Determination in Flue-Cured Tobacco Powder by Near-Infrared (NIR) Spectroscopy" LINK
"Prediction and Utilization of Malondialdehyde in Exotic Pine Under Drought Stress Using Near-Infrared Spectroscopy" | LINK
"Quantification of irrigated lesion morphology using near-infrared spectroscopy" | LINK
"A Comparison between the Post-and Pre-dispersive Near Infrared Spectroscopy in Non-Destructive Brix Prediction Using Artificial Neural Network" LINK
Infrared Spectroscopy (IR) and Near-Infrared Spectroscopy (NIR)
"Efficient Broadband Near‐Infrared Emission in the GaTaO4:Cr3+ Phosphor" | LINK
"Aflatoxin contaminated cocoa beans classification using near-infrared spectroscopy" LINK
"The Effect Of Hemodynamic Parameters On Peripheral Near Infrared Spectroscopy In An Animal Model" LINK
"Iridium(III) Complexes with [2, 1, 0] Charged Ligands Realized DeepRed/NearInfrared Phosphorescent Emission" LINK
Raman Spectroscopy
"Multivariate Analysis Aided Surface-Enhanced Raman Spectroscopy (MVA-SERS) Multiplex Quantitative Detection of Trace Fentanyl in Illicit Drug Mixtures Using a Handheld Raman Spectrometer" LINK
Hyperspectral Imaging (HSI)
"BRCN-ERN: A Bidirectional Reconstruction Coding Network and Enhanced Residual Network for Hyperspectral Change Detection" LINK
"Rapid identification of adulterated safflower seed oil by use of hyperspectral spectroscopy" LINK
"Remote Sensing : Monitoring the Severity of Pantana phyllostachysae Chao on Bamboo Using Leaf Hyperspectral Data" LINK
"Rapid identification of the green tea geographical origin and processing month based on near-infrared hyperspectral imaging combined with chemometrics" LINK
"Chemometric strategies for near infrared hyperspectral imaging analysis: classification of cotton seed genotypes" LINK
"Applied Sciences : Determination of Sugar, pH, and Anthocyanin Contents in Port Wine Grape Berries through Hyperspectral Imaging: An Extensive Comparison of Linear and Non-Linear Predictive Methods" LINK
"... Area Index, Chlorophyll Content and Fraction of Vegetation Cover Using an Empirical-Statistical Approach from Chris-Proba Satellite Hyperspectral Images over the ..." LINK
"Design and verification of a large-field hyperspectral imaging system" LINK
"Visualization of heavy metal cadmium in lettuce leaves based on wavelet support vector machine regression model and visible‐near infrared hyperspectral imaging" LINK
"Band Selection for HSI Classification using Binary Constrained Optimization" LINK
"New Approach to the Old Challenge of Free Flap Monitoring—Hyperspectral Imaging Outperforms Clinical Assessment by Earlier Detection of Perfusion Failure" LINK
Spectral Imaging
"Machine learning and hyper spectral imaging: multi spectral endoscopy in the gastro intestinal tract towards hyper spectral endoscopy" LINK
Chemometrics and Machine Learning
"... residual extreme learning machine (PLSRR-ELM) calibration algorithm applied in fast determination of gasoline octane number with near-infrared spectroscopy" LINK
"Recognition of authentic or false blood based on NIR spectroscopy and PCA-WNN-PSO algorithm" LINK
"EVALUATION OF AGARWOOD (AQUILARIA MALACCENIS) FROM BINTAN ISLAND BASED ON INDONESIAN STANDARD: PREDICTING ITS QUALITY USING ..." LINK
"Comparison of PLS and SVM models for soil organic matter and particle size using vis-NIR spectral libraries" LINK
"Multivariate Calibration of Concentrations of C, Mn, Si, Cr, Ni, and Cu in Low-Alloy Steels from Raw Low-Resolution Spectra Obtained By Laser-Induced Breakdown Spectroscopy" LINK
Optics for Spectroscopy
"Foam Flows in Turbulent Liquid Exfoliation of Layered Materials and Implications for Graphene Production and Inline Characterisation" LINK
"Chemical Engineering of Cu-Sn Disordered Network Metamaterials" LINK
"High-Performance Waveguide-Integrated Bi<sub>2</sub>O<sub>2</sub>Se Photodetector for Si Photonic Integrated Circuits" LINK
Equipment for Spectroscopy
"Electrical and Mechanical Properties of Intrinsically Flexible and Stretchable PEDOT Polymers for Thermotherapy" LINK
"Application of hand-held near-infrared and Raman spectrometers in surface treatment authentication of cork stoppers" LINK
Process Control and NIR Sensors
"Dry Powder Mixing Is Feasible in Continuous Twin Screw Extruder: Towards Lean Extrusion Process for Oral Solid Dosage Manufacturing" | LINK
"Manipulating electroluminochromism behavior of viologen substituted iridium(III) complexes through ligand engineering for information display and encryption" LINK
Environment NIR-Spectroscopy Application
"Remote Sensing : Estimating Vertical Distribution of Leaf Water Content within Wheat Canopies after Head Emergence" LINK
Agriculture NIR-Spectroscopy Usage
"Towards ecological intensification of agriculture: from management to soil bacterial and nitrogen-cycling communities" LINK
"Er: YAG Laser Cleaning of Painted Surfaces: Functional Considerations to Improve Efficacy and Reduce Side Effects" LINK
"Agronomy : Evaluation of Metabolomic Profile and Growth of Moringa oleifera L. Cultivated with Vermicompost under Different Soil Types" LINK
"High-throughput phenotyping of cool-season crops using non-invasive sensing techniques" LINK
Forestry and Wood Industry NIR Usage
"Polymers : Passive Fire Protection of Taeda pine Wood by Using Starch-Based Surface Coatings" LINK
Food & Feed Industry NIR Usage
"Foods : Microbiological Quality Assessment of Chicken Thigh Fillets Using Spectroscopic Sensors and Multivariate Data Analysis" LINK
"The potential to increase beef production in tropical Nth Australia by including Desmanthus cv JCU 2 in a Buffel grass (Cenchrus ciliaris) dominant pasture" LINK
Pharma Industry NIR Usage
"Spectroscopic characteristics of Xeloda chemodrug" | LINK
Laboratory and NIR-Spectroscopy
"Potential of laboratory hyperspectral data for in-field detection of Phytophthora infestans on potato" LINK
Other
"Beam test of carbon ion production for development of new compact ECR ion source for multi ion therapy" LINK
"Silver Peroxide Nanoparticles for Combined Antibacterial Sonodynamic and Photothermal Therapy" | LINK
"Splanchnic oxygen saturation during reoxygenation with 21% or 100% O2 in newborn piglets" | LINK
This week's NIR news Weekly is sponsored by Your-Company-Name-Here - NIR-spectrometers. Check out their product page ... link
Get the Spectroscopy and Chemometrics News Weekly in real time on Twitter @ CalibModel and follow us.
Near-Infrared Spectroscopy (NIRS)
"Development and Submission of Near Infrared Analytical Procedures Guidance for Industry" FDA LINK
"Identification prediction moisture content of Thai coconut sugar (Cocos nucifera L.) using FT-NIR spectroscopy" LINK
"Blood identification of NIR spectroscopy based on BP neural network combined with particle swarm optimization" LINK
"A preliminary study on the utilisation of near infrared spectroscopy to predict age and in vivo human metabolism" LINK
"Near-infrared guidance finalized for small molecule testing, with biologics to come" RAPS LINK
"Wavelength Selection Method for Near Infrared Spectroscopy Based on Iteratively Retains Informative Variables and Successive Projections Algorithm" LINK
"Near-infrared spectroscopy calibration strategies to predict multiple nutritional parameters of pasture species from different" LINK
" Comparison of metabolites and variety authentication of Amomum tsao-ko and Amomum paratsao-ko using GC-MS and NIR spectroscopy" LINK
"Hyperfine-Resolved Near-Infrared Spectra of H(2)(17)O" LINK
"Geographical Differentiation of Hom Mali Rice Cultivated in Different Regions of Thailand Using FTIR-ATR and NIR Spectroscopy" LINK
"Seasonal Snowpack Classification Based on Physical Properties Using Near-Infrared Proximal Hyperspectral Data" | LINK
"NIR-based sensing system for non-Invasive detection of Hemoglobin for point-of-care applications" LINK
"A promising inorganic YFeO3 pigments with high near-infrared reflectance and infrared emission" LINK
"Classification of Softwoods using Wood Extract Information and Near Infrared Spectroscopy." LINK
"Rapid determination and origin identification of total polysaccharides contents in Schisandra chinensis by near-infrared spectroscopy" LINK
"Near-Infrared Spectroscopy Technology in Food" | LINK
"Postharvest ripeness assessment of 'Hass' avocado based on development of a new ripening index and Vis-NIR spectroscopy" LINK
Infrared Spectroscopy (IR) and Near-Infrared Spectroscopy (NIR)
"Utility of near‐infrared spectroscopy to detect the extent of lipid core plaque leading to periprocedural myocardial infarction" LINK
"Scaling up Sagebrush Chemistry with Near-Infrared Spectroscopy and Uas-Acquired Hyperspectral Imagery" LINK
Hyperspectral Imaging (HSI)
"Spatially Resolved Spectroscopic Characterization of Nanostructured Films by Hyperspectral Dark-Field Microscopy" LINK
"Visual attention-driven framework to incorporate spatial-spectral features for hyperspectral anomaly detection" LINK
Spectral Imaging
"Spectral Super-Resolution of Multispectral Images Using Spatial-Spectral Residual Attention Network" LINK
Chemometrics and Machine Learning
"Feasibility of a chromameter and chemometric techniques to discriminate pure and mixed organic and conventional red pepper powders: A pilot study" LINK
"Cyanobacteria cell prediction using interpretable deep learning model with observed, numerical, and sensing data assemblage" LINK
"Applied Sciences : A Novel Principal Component Analysis Integrating Long Short-Term Memory Network and Its Application in Productivity Prediction of Cutter Suction Dredgers" LINK
"Plants : Morpho-Physiological Classification of Italian Tomato Cultivars (Solanum lycopersicum L.) According to Drought Tolerance during Vegetative and Reproductive Growth" LINK
"Automatic food and beverage authentication and adulteration detection by classification hybrid fusion" LINK
"Remote Sensing : Improving Accuracy of Herbage Yield Predictions in Perennial Ryegrass with UAV-Based Structural and Spectral Data Fusion and Machine Learning" LINK
"Estimating Fat Components of Potato Chips Using Visible and Near-Infrared Spectroscopy and a Compositional Calibration Model" LINK
"Wavelengths selection based on genetic algorithm (GA) and successive projections algorithms (SPA) combine with PLS regression for determination the soluble ..." LINK
"Comparison of PLS and SVM models for soil organic matter and particle size using vis-NIR spectral libraries" LINK
"Verified the rapid evaluation of the edible safety of wild porcini mushrooms, using deep learning and PLS‐DA" LINK
Optics for Spectroscopy
"Scientists Teach AI Cameras to See Depth in Photos Better" AI Camera Depth LINK
Facts
"Deep learning accelerates super-resolution microscopy by up to ten times" | DeepLearning microscopy LINK
"Statistical Learning to Operationalize a Domain Agnostic Data Quality Scoring. (arXiv:2108.08905v1 [cs.LG])" LINK
Research on Spectroscopy
"Foods : Instrumentation for Routine Analysis of Acrylamide in French Fries: Assessing Limitations for Adoption" LINK
Process Control and NIR Sensors
"NIR spectroscopy for monitoring of the critical manufacturing steps and quality attributes of paliperidone prolonged release tablets" LINK
Environment NIR-Spectroscopy Application
"Spatial Differentiation Analysis of Water Quality in Dianchi Lake Based on GF-5 NDVI Characteristic Optimization" LINK
"Remote Sensing : Using Sentinel-2 for Simplifying Soil Sampling and Mapping: Two Case Studies in Umbria, Italy" LINK
"Sensors : Ground-Based Hyperspectral Remote Sensing for Estimating Water Stress in Tomato Growth in Sandy Loam and Silty Loam Soils" LINK
"Potential of high-spectral resolution for field phenotyping in plant breeding: Application to maize under water stress" LINK
Agriculture NIR-Spectroscopy Usage
"Study the Genetic Diversity in Protein, Zinc and Iron in Germplasm Pools of Desi Type Chickpeas as Implicated in Quality Breeding" LINK
"Additives and soy detection in powder rice beverage by vibrational spectroscopy as an alternative method for quality and safety control" LINK
"Remote Sensing : Generating Up-to-Date Crop Maps Optimized for Sentinel-2 Imagery in Israel" LINK
"Fodder biomass, nutritive value, and grain yield of dual‐purpose Pearl Millet, Sorghum and Maize cultivars across different agro‐ecologies in Burkina Faso" LINK
"Agronomy : Effects of the Foliar Application of Potassium Fertilizer on the Grain Protein and Dough Quality of Wheat" LINK
"Remote Sensing : Sentinel-2 and Landsat-8 Multi-Temporal Series to Estimate Topsoil Properties on Croplands" LINK
"Sensors : Assessment of Grain Harvest Moisture Content Using Machine Learning on Smartphone Images for Optimal Harvest Timing" LINK
"Using UAV image data to monitor the effects of different nitrogen application rates on tea quality" LINK
"A single calibration of near-infrared spectroscopy to determine the quality of forage for multiple species" LINK
"Foods : Temporal Sensory Perceptions of Sugar-Reduced 3D Printed Chocolates" LINK
"Foods : Rapid Nondestructive Simultaneous Detection for Physicochemical Properties of Different Types of Sheep Meat Cut Using Portable Vis/NIR Reflectance Spectroscopy System" LINK
"Foods : Real-Time Gauging of the Gelling Maturity of Duck Eggs Pickled in Strong Alkaline Solutions" LINK
Chemical Industry NIR Usage
"Polymers : Drug Amorphous Solid Dispersions Based on Poly(vinyl Alcohol): Evaluating the Effect of Poly(propylene Succinate) as Plasticizer" LINK
Pharma Industry NIR Usage
" Effects of acetazolamide and furosemide on ventilation and cerebral blood volume in normocapnic and hypercapnic COPD patients" LINK
Other
"Advances, challenges and perspectives of quantum chemical approaches in molecular spectroscopy of the condensed phase" LINK
"Calidad composicional y sensorial de la carne bovina y su determinación mediante infrarrojo cercano" LINK
"Bioinspired StimuliResponsive Hydrogel with Reversible Switching and Fluorescence Behavior Served as LightControlled Soft Actuators" LINK
"Neural Efficiency in Athletes: A Systematic Review" LINK
"Tailored Chiral Copper Selenide Nanochannels for Ultrasensitive Enantioselective Recognition and Detection" LINK
"In vivo diffuse reflectance spectroscopic analysis of fatty liver with inflammation in mice" LINK
"Métodos de análise da composição química e valor nutricional de alimentos para ruminantes" LINK
"Dissociation between exercise intensity thresholds: mechanistic insights from supine exercise" LINK
NIR Calibration-Model Services
Spectroscopy and Chemometrics/Machine-Learning News Weekly 41, 2021 | NIRS NIR Spectroscopy MachineLearning Spectrometer Spectrometric Analytical Chemistry Chemical Analysis Lab Labs Laboratories Laboratory Software IoT Sensor QA QC Testing Quality LINK
This week's NIR news Weekly is sponsored by Your-Company-Name-Here - NIR-spectrometers. Check out their product page ... link
Get the Spectroscopy and Chemometrics News Weekly in real time on Twitter @ CalibModel and follow us.
Near-Infrared Spectroscopy (NIRS)
"Development and Submission of Near Infrared Analytical Procedures Guidance for Industry" FDA LINK
"Identification prediction moisture content of Thai coconut sugar (Cocos nucifera L.) using FT-NIR spectroscopy" LINK
"Blood identification of NIR spectroscopy based on BP neural network combined with particle swarm optimization" LINK
"A preliminary study on the utilisation of near infrared spectroscopy to predict age and in vivo human metabolism" LINK
"Near-infrared guidance finalized for small molecule testing, with biologics to come" RAPS LINK
"Wavelength Selection Method for Near Infrared Spectroscopy Based on Iteratively Retains Informative Variables and Successive Projections Algorithm" LINK
"Near-infrared spectroscopy calibration strategies to predict multiple nutritional parameters of pasture species from different" LINK
" Comparison of metabolites and variety authentication of Amomum tsao-ko and Amomum paratsao-ko using GC-MS and NIR spectroscopy" LINK
"Hyperfine-Resolved Near-Infrared Spectra of H(2)(17)O" LINK
"Geographical Differentiation of Hom Mali Rice Cultivated in Different Regions of Thailand Using FTIR-ATR and NIR Spectroscopy" LINK
"Seasonal Snowpack Classification Based on Physical Properties Using Near-Infrared Proximal Hyperspectral Data" | LINK
"NIR-based sensing system for non-Invasive detection of Hemoglobin for point-of-care applications" LINK
"A promising inorganic YFeO3 pigments with high near-infrared reflectance and infrared emission" LINK
"Classification of Softwoods using Wood Extract Information and Near Infrared Spectroscopy." LINK
"Rapid determination and origin identification of total polysaccharides contents in Schisandra chinensis by near-infrared spectroscopy" LINK
"Near-Infrared Spectroscopy Technology in Food" | LINK
"Postharvest ripeness assessment of 'Hass' avocado based on development of a new ripening index and Vis-NIR spectroscopy" LINK
Infrared Spectroscopy (IR) and Near-Infrared Spectroscopy (NIR)
"Utility of near‐infrared spectroscopy to detect the extent of lipid core plaque leading to periprocedural myocardial infarction" LINK
"Scaling up Sagebrush Chemistry with Near-Infrared Spectroscopy and Uas-Acquired Hyperspectral Imagery" LINK
Hyperspectral Imaging (HSI)
"Spatially Resolved Spectroscopic Characterization of Nanostructured Films by Hyperspectral Dark-Field Microscopy" LINK
"Visual attention-driven framework to incorporate spatial-spectral features for hyperspectral anomaly detection" LINK
Spectral Imaging
"Spectral Super-Resolution of Multispectral Images Using Spatial-Spectral Residual Attention Network" LINK
Chemometrics and Machine Learning
"Feasibility of a chromameter and chemometric techniques to discriminate pure and mixed organic and conventional red pepper powders: A pilot study" LINK
"Cyanobacteria cell prediction using interpretable deep learning model with observed, numerical, and sensing data assemblage" LINK
"Applied Sciences : A Novel Principal Component Analysis Integrating Long Short-Term Memory Network and Its Application in Productivity Prediction of Cutter Suction Dredgers" LINK
"Plants : Morpho-Physiological Classification of Italian Tomato Cultivars (Solanum lycopersicum L.) According to Drought Tolerance during Vegetative and Reproductive Growth" LINK
"Automatic food and beverage authentication and adulteration detection by classification hybrid fusion" LINK
"Remote Sensing : Improving Accuracy of Herbage Yield Predictions in Perennial Ryegrass with UAV-Based Structural and Spectral Data Fusion and Machine Learning" LINK
"Estimating Fat Components of Potato Chips Using Visible and Near-Infrared Spectroscopy and a Compositional Calibration Model" LINK
"Wavelengths selection based on genetic algorithm (GA) and successive projections algorithms (SPA) combine with PLS regression for determination the soluble ..." LINK
"Comparison of PLS and SVM models for soil organic matter and particle size using vis-NIR spectral libraries" LINK
"Verified the rapid evaluation of the edible safety of wild porcini mushrooms, using deep learning and PLS‐DA" LINK
Optics for Spectroscopy
"Scientists Teach AI Cameras to See Depth in Photos Better" AI Camera Depth LINK
Facts
"Deep learning accelerates super-resolution microscopy by up to ten times" | DeepLearning microscopy LINK
"Statistical Learning to Operationalize a Domain Agnostic Data Quality Scoring. (arXiv:2108.08905v1 [cs.LG])" LINK
Research on Spectroscopy
"Foods : Instrumentation for Routine Analysis of Acrylamide in French Fries: Assessing Limitations for Adoption" LINK
Process Control and NIR Sensors
"NIR spectroscopy for monitoring of the critical manufacturing steps and quality attributes of paliperidone prolonged release tablets" LINK
Environment NIR-Spectroscopy Application
"Spatial Differentiation Analysis of Water Quality in Dianchi Lake Based on GF-5 NDVI Characteristic Optimization" LINK
"Remote Sensing : Using Sentinel-2 for Simplifying Soil Sampling and Mapping: Two Case Studies in Umbria, Italy" LINK
"Sensors : Ground-Based Hyperspectral Remote Sensing for Estimating Water Stress in Tomato Growth in Sandy Loam and Silty Loam Soils" LINK
"Potential of high-spectral resolution for field phenotyping in plant breeding: Application to maize under water stress" LINK
Agriculture NIR-Spectroscopy Usage
"Study the Genetic Diversity in Protein, Zinc and Iron in Germplasm Pools of Desi Type Chickpeas as Implicated in Quality Breeding" LINK
"Additives and soy detection in powder rice beverage by vibrational spectroscopy as an alternative method for quality and safety control" LINK
"Remote Sensing : Generating Up-to-Date Crop Maps Optimized for Sentinel-2 Imagery in Israel" LINK
"Fodder biomass, nutritive value, and grain yield of dual‐purpose Pearl Millet, Sorghum and Maize cultivars across different agro‐ecologies in Burkina Faso" LINK
"Agronomy : Effects of the Foliar Application of Potassium Fertilizer on the Grain Protein and Dough Quality of Wheat" LINK
"Remote Sensing : Sentinel-2 and Landsat-8 Multi-Temporal Series to Estimate Topsoil Properties on Croplands" LINK
"Sensors : Assessment of Grain Harvest Moisture Content Using Machine Learning on Smartphone Images for Optimal Harvest Timing" LINK
"Using UAV image data to monitor the effects of different nitrogen application rates on tea quality" LINK
"A single calibration of near-infrared spectroscopy to determine the quality of forage for multiple species" LINK
"Foods : Temporal Sensory Perceptions of Sugar-Reduced 3D Printed Chocolates" LINK
"Foods : Rapid Nondestructive Simultaneous Detection for Physicochemical Properties of Different Types of Sheep Meat Cut Using Portable Vis/NIR Reflectance Spectroscopy System" LINK
"Foods : Real-Time Gauging of the Gelling Maturity of Duck Eggs Pickled in Strong Alkaline Solutions" LINK
Chemical Industry NIR Usage
"Polymers : Drug Amorphous Solid Dispersions Based on Poly(vinyl Alcohol): Evaluating the Effect of Poly(propylene Succinate) as Plasticizer" LINK
Pharma Industry NIR Usage
" Effects of acetazolamide and furosemide on ventilation and cerebral blood volume in normocapnic and hypercapnic COPD patients" LINK
Other
"Advances, challenges and perspectives of quantum chemical approaches in molecular spectroscopy of the condensed phase" LINK
"Calidad composicional y sensorial de la carne bovina y su determinación mediante infrarrojo cercano" LINK
"Bioinspired StimuliResponsive Hydrogel with Reversible Switching and Fluorescence Behavior Served as LightControlled Soft Actuators" LINK
"Neural Efficiency in Athletes: A Systematic Review" LINK
"Tailored Chiral Copper Selenide Nanochannels for Ultrasensitive Enantioselective Recognition and Detection" LINK
"In vivo diffuse reflectance spectroscopic analysis of fatty liver with inflammation in mice" LINK
"Métodos de análise da composição química e valor nutricional de alimentos para ruminantes" LINK
"Dissociation between exercise intensity thresholds: mechanistic insights from supine exercise" LINK
NIR User? Get better results faster | Food Science QC Lab Laboratory Manager chemist LabWork Chemie Analytik LINK
Spectroscopy and Chemometrics News Weekly 27, 2021 | NIRS NIR Spectroscopy MachineLearning Spectrometer Spectrometric Analytical Chemistry Chemical Analysis Lab Labs Laboratories Laboratory Software IoT Sensors QA QC Testing Quality LINK
This week's NIR news Weekly is sponsored by Your-Company-Name-Here - NIR-spectrometers. Check out their product page ... link
Get the Spectroscopy and Chemometrics News Weekly in real time on Twitter @ CalibModel and follow us.
Near-Infrared Spectroscopy (NIRS)
"17th International Conference on Near Infrared Spectroscopy-Book of Abstracts" |ience/nir-abstracts/papers/near-infrared-spectroscopy-using-a-supercontinuum-laser---application-to-long-wavelength-transmission-spectra-of-barley- LINK
"Prediction Performance and Economic Efficiency of Soft Sensors for in-Line Water Content Monitoring in Fluidized Bed Granulation: PP-Based Model vs. NIRS-Based ..." LINK
"Evaluation of Quality Parameters of Açaí Oil During Thermal Oxidation Using NIRS and Chemometrics" | LINK
"Caffeine content calibration model on green beans arabica Mandailing Natal coffee using NIRS and artificial neural network" LINK
"PREDICTING HYPERGLYCEMIA USING NIR SPECTRUM OF SPENT FLUID IN HEMODIALYSIS PATIENTS" LINK
"Determination of multiple components in urine using FT-MIR, NIR, and FT-Raman spectroscopic" LINK
"Near-Infrared Spectroscopy (NIRS) and Optical Sensors for Estimating Protein and Fiber in Dryland Mediterranean Pastures. AgriEngineering 2021LINK
Infrared Spectroscopy (IR) and Near-Infrared Spectroscopy (NIR)
"A simple multiple linear regression model in near infrared spectroscopy for soluble solids content of pomegranate arils based on stability competitive adaptive re ..." LINK
"Nondestructive determination of GABA in germinated brown rice with near infrared spectroscopy based on wavelet transform denoising" LINK
"Soil characterization by near-infrared spectroscopy and principal component analysis1" LINK
"Classification of Prefrontal Cortex Activity Based on Functional Near-Infrared Spectroscopy Data upon Olfactory Stimulation" LINK
"Determination of Fatty Acid Content of Rice during Storage Based on Feature Fusion of Olfactory Visualization Sensor Data and Near-Infrared Spectra" LINK
"Near infrared spectroscopy to rapid assess the rubber tree clone and the influence of maturation and disease at the leaves" LINK
"Fraud Detection in Batches of Sweet Almonds by Portable Near-Infrared Spectral Devices" LINK
"Near Infrared Reflectance Spectroscopy Analysis to Predict Diet Composition of a Mountain Ungulate Species" LINK
"Simultaneous determination of five micro-components in Chrysanthemum morifolium (Hangbaiju) using near-infrared hyperspectral imaging coupled with deep ..." LINK
"NEAR-INFRARED SPECTROSCOPY ANALYSIS TECHNOLOGY BASED ON SINGLE SAMPLE" LINK
"Mineralogy of the far-side lunar surface explored by Chang'E-4 with visible and near-infrared reflectance spectra" LINK
"Precise high-throughput online near-infrared spectroscopy assay to determine key cell wall features associated with sugarcane bagasse digestibility" | LINK
Raman Spectroscopy
"Noninvasive identification of turmeric and saffron dyes in proteinaceous textile fibres using Raman spectroscopy and multivariate analysis" LINK
"Raman Spectroscopy Can Distinguish Glyphosate-Susceptible and -Resistant Palmer Amaranth (Amaranthus palmeri)" | LINK
"Possibility of Human Gender Recognition Using Raman Spectra of Teeth" LINK
Hyperspectral Imaging (HSI)
"Fusion of Hyperspectral Images. Looking at the structure of vegetal tissues: a case study." LINK
"Hyperspectral imaging for prediction of surface roughness in laser powder bed fusion" LINK
"The Applications of Hyperspectral Imaging Technology for Agricultural Products Quality Analysis: A Review" LINK
"Design and demonstration of airborne imaging system for target detection based on area-array camera and push-broom hyperspectral imager" LINK
"Unaligned Hyperspectral Image Fusion via Registration and Interpolation Modeling" LINK
Chemometrics and Machine Learning
"Generalized Unsupervised Clustering of Hyperspectral Images of Geological Targets in the Near Infrared" LINK
"Foods : Sensory and Olfactometry Chemometrics as Valuable Tools for Assessing Hops Aroma Impact on Dry-Hopped Beers: A Study with Wild Portuguese Genotypes" LINK
"A fast and low-cost approach to quality control of alcohol-based hand sanitizer using a portable near infrared spectrometer and chemometrics" LINK
"Monitoring vitamin C extraction using multivariate calibration models by NIR1" LINK
"Remote Sensing : Inter-Annual Variability in the Antarctic Ice Sheets Using Geodetic Observations and a Climate Model" LINK
"Sensors : Radar Sensing for Activity Classification in Elderly People Exploiting Micro-Doppler Signatures Using Machine Learning" LINK
"Remote Sensing : UAV Remote Sensing Estimation of Rice Yield Based on Adaptive Spectral Endmembers and Bilinear Mixing Model" LINK
"Foods : Amino Acid Profiling with Chemometric Analysis as a Feasible Tool for the Discrimination of Marine-Derived Peptide Powders" LINK
"Sensors : Multi-Scale Superpixels Dimension Reduction Hyperspectral Image Classification Algorithm Based on Low Rank Sparse Representation Joint Hierarchical Recursive Filtering" LINK
"A regional-scale hyperspectral prediction model of soil organic carbon considering geomorphic features" LINK
"Molecules : In Situ Decarboxylation-Pressurized Hot Water Extraction for Selective Extraction of Cannabinoids from Cannabis sativa. Chemometric Approach" LINK
"A robot system for the autodetection and classification of apple internal quality attributes" LINK
"Calibration Maintenance Application of Near-infrared Spectrometric Model in Food Analysis" LINK
"Spectroscopic measurement approaches in evaluation of dry rubber content of cup lump rubber using machine learning techniques" LINK
"Dodecyl-substituted poly (3, 4-ethylenedioxyselenophene): polymerization and its solution-processable applications for electrochromic and organic solar cells" | LINK
"Application of Visible/Near Infrared Spectrometers to Quickly Detect the Nitrogen, Phosphorus, and Potassium Content of Chemical Fertilizers" Applied Sciences LINK
Process Control and NIR Sensors
"Unveiling meloxicam monohydrate process of dehydration by an at-line vibrational multi-spectroscopy approach" LINK
Environment NIR-Spectroscopy Application
"Minerals : Multisource Data Analysis for Gold Potentiality Mapping of Atalla Area and Its Environs, Central Eastern Desert, Egypt" LINK
"Effect of Biofertilizers Application on Soil Biodiversity and Litter Degradation in a Commercial Apricot Orchard" LINK
"Agronomy : Genotypic and Environmental Effect on the Concentration of Phytochemical Contents of Lentil (Lens culinaris L.)" LINK
"Chemosensors : A Potentiometric Electronic Tongue as a Discrimination Tool of Water-Food Indicator/Contamination Bacteria" LINK
Agriculture NIR-Spectroscopy Usage
"Near infrared spectroscopy of plantation forest soil nutrients in Sabah, Malaysia, and the potential for microsite assessment" LINK
"Beverages : Physicochemical Changes Occurring during Long-Time Fermentation of the Indigenous Alcoholic Sorghum-Based Beverages Brewed in Northern Cameroon" LINK
"Leveraging Computer Vision for Applications in Biomedicine and Geoscience" | LINK
"Dietary Patterns and the Risk of Inflammatory Bowel Disease: Findings from a Case-Control Study" Nutrients LINK
"Soil Nutrient and Vegetation Diversity Patterns of Alpine Wetlands on the Qinghai-Tibetan Plateau" Sustainability LINK
"Assessment of Soil Quality under Different Soil Management Strategies: Combined Use of Statistical Approaches to Select the Most Informative Soil Physico-Chemical Indicators" Applied Sciences LINK
"Nondestructive phenotyping fatty acid trait of single soybean seeds using reflective hyperspectral imagery" LINK
Horticulture NIR-Spectroscopy Applications
"Neural Network based Prediction of Soluble Solids Concentrationin Oriental Melon using VIS/NIR spectroscopy" LINK
Food & Feed Industry NIR Usage
"Nondestructive identification of barley seeds varieties using hyperspectral data from two sides of barley seeds" LINK
"The effect of cryogrinding and size separation on bioactive profile of buckwheat hulls" LINK
"Vis-NIR spectroscopic and chemometric models for detecting contamination of premium green banana flour with wheat by quantifying resistant starch content" LINK
Other
"Sustainability : The Role of Co-Creating Value and Its Outcomes in Higher Education Marketing" LINK
"Multitechnique characterization of glass mosaic tesserae from Villa di Teodorico in Galeata (Italy)" LINK
"Controlled pDNA Release in Gemini Cationic Lipoplexes by Femtosecond Laser Irradiation of Gold Nanostars" LINK
"Random Lasing Detection of Mutant Huntingtin Expression in Cells" Sensors LINK
"Multi-sensors data fusion approach for site-specific seeding of consumption and seed potato production" | LINK
.
NIR Calibration-Model Services
NIR User? Get better results faster | Food Science QC Lab Laboratory Manager chemist LabWork Chemie Analytik LINK
This week's NIR news Weekly is sponsored by Your-Company-Name-Here - NIR-spectrometers. Check out their product page ... link
Get the Spectroscopy and Chemometrics News Weekly in real time on Twitter @ CalibModel and follow us.
Near-Infrared Spectroscopy (NIRS)
"17th International Conference on Near Infrared Spectroscopy-Book of Abstracts" |ience/nir-abstracts/papers/near-infrared-spectroscopy-using-a-supercontinuum-laser---application-to-long-wavelength-transmission-spectra-of-barley- LINK
"Prediction Performance and Economic Efficiency of Soft Sensors for in-Line Water Content Monitoring in Fluidized Bed Granulation: PP-Based Model vs. NIRS-Based ..." LINK
"Evaluation of Quality Parameters of Açaí Oil During Thermal Oxidation Using NIRS and Chemometrics" | LINK
"Caffeine content calibration model on green beans arabica Mandailing Natal coffee using NIRS and artificial neural network" LINK
"PREDICTING HYPERGLYCEMIA USING NIR SPECTRUM OF SPENT FLUID IN HEMODIALYSIS PATIENTS" LINK
"Determination of multiple components in urine using FT-MIR, NIR, and FT-Raman spectroscopic" LINK
"Near-Infrared Spectroscopy (NIRS) and Optical Sensors for Estimating Protein and Fiber in Dryland Mediterranean Pastures. AgriEngineering 2021LINK
Infrared Spectroscopy (IR) and Near-Infrared Spectroscopy (NIR)
"A simple multiple linear regression model in near infrared spectroscopy for soluble solids content of pomegranate arils based on stability competitive adaptive re ..." LINK
"Nondestructive determination of GABA in germinated brown rice with near infrared spectroscopy based on wavelet transform denoising" LINK
"Soil characterization by near-infrared spectroscopy and principal component analysis1" LINK
"Classification of Prefrontal Cortex Activity Based on Functional Near-Infrared Spectroscopy Data upon Olfactory Stimulation" LINK
"Determination of Fatty Acid Content of Rice during Storage Based on Feature Fusion of Olfactory Visualization Sensor Data and Near-Infrared Spectra" LINK
"Near infrared spectroscopy to rapid assess the rubber tree clone and the influence of maturation and disease at the leaves" LINK
"Fraud Detection in Batches of Sweet Almonds by Portable Near-Infrared Spectral Devices" LINK
"Near Infrared Reflectance Spectroscopy Analysis to Predict Diet Composition of a Mountain Ungulate Species" LINK
"Simultaneous determination of five micro-components in Chrysanthemum morifolium (Hangbaiju) using near-infrared hyperspectral imaging coupled with deep ..." LINK
"NEAR-INFRARED SPECTROSCOPY ANALYSIS TECHNOLOGY BASED ON SINGLE SAMPLE" LINK
"Mineralogy of the far-side lunar surface explored by Chang'E-4 with visible and near-infrared reflectance spectra" LINK
"Precise high-throughput online near-infrared spectroscopy assay to determine key cell wall features associated with sugarcane bagasse digestibility" | LINK
Raman Spectroscopy
"Noninvasive identification of turmeric and saffron dyes in proteinaceous textile fibres using Raman spectroscopy and multivariate analysis" LINK
"Raman Spectroscopy Can Distinguish Glyphosate-Susceptible and -Resistant Palmer Amaranth (Amaranthus palmeri)" | LINK
"Possibility of Human Gender Recognition Using Raman Spectra of Teeth" LINK
Hyperspectral Imaging (HSI)
"Fusion of Hyperspectral Images. Looking at the structure of vegetal tissues: a case study." LINK
"Hyperspectral imaging for prediction of surface roughness in laser powder bed fusion" LINK
"The Applications of Hyperspectral Imaging Technology for Agricultural Products Quality Analysis: A Review" LINK
"Design and demonstration of airborne imaging system for target detection based on area-array camera and push-broom hyperspectral imager" LINK
"Unaligned Hyperspectral Image Fusion via Registration and Interpolation Modeling" LINK
Chemometrics and Machine Learning
"Generalized Unsupervised Clustering of Hyperspectral Images of Geological Targets in the Near Infrared" LINK
"Foods : Sensory and Olfactometry Chemometrics as Valuable Tools for Assessing Hops Aroma Impact on Dry-Hopped Beers: A Study with Wild Portuguese Genotypes" LINK
"A fast and low-cost approach to quality control of alcohol-based hand sanitizer using a portable near infrared spectrometer and chemometrics" LINK
"Monitoring vitamin C extraction using multivariate calibration models by NIR1" LINK
"Remote Sensing : Inter-Annual Variability in the Antarctic Ice Sheets Using Geodetic Observations and a Climate Model" LINK
"Sensors : Radar Sensing for Activity Classification in Elderly People Exploiting Micro-Doppler Signatures Using Machine Learning" LINK
"Remote Sensing : UAV Remote Sensing Estimation of Rice Yield Based on Adaptive Spectral Endmembers and Bilinear Mixing Model" LINK
"Foods : Amino Acid Profiling with Chemometric Analysis as a Feasible Tool for the Discrimination of Marine-Derived Peptide Powders" LINK
"Sensors : Multi-Scale Superpixels Dimension Reduction Hyperspectral Image Classification Algorithm Based on Low Rank Sparse Representation Joint Hierarchical Recursive Filtering" LINK
"A regional-scale hyperspectral prediction model of soil organic carbon considering geomorphic features" LINK
"Molecules : In Situ Decarboxylation-Pressurized Hot Water Extraction for Selective Extraction of Cannabinoids from Cannabis sativa. Chemometric Approach" LINK
"A robot system for the autodetection and classification of apple internal quality attributes" LINK
"Calibration Maintenance Application of Near-infrared Spectrometric Model in Food Analysis" LINK
"Spectroscopic measurement approaches in evaluation of dry rubber content of cup lump rubber using machine learning techniques" LINK
"Dodecyl-substituted poly (3, 4-ethylenedioxyselenophene): polymerization and its solution-processable applications for electrochromic and organic solar cells" | LINK
"Application of Visible/Near Infrared Spectrometers to Quickly Detect the Nitrogen, Phosphorus, and Potassium Content of Chemical Fertilizers" Applied Sciences LINK
Process Control and NIR Sensors
"Unveiling meloxicam monohydrate process of dehydration by an at-line vibrational multi-spectroscopy approach" LINK
Environment NIR-Spectroscopy Application
"Minerals : Multisource Data Analysis for Gold Potentiality Mapping of Atalla Area and Its Environs, Central Eastern Desert, Egypt" LINK
"Effect of Biofertilizers Application on Soil Biodiversity and Litter Degradation in a Commercial Apricot Orchard" LINK
"Agronomy : Genotypic and Environmental Effect on the Concentration of Phytochemical Contents of Lentil (Lens culinaris L.)" LINK
"Chemosensors : A Potentiometric Electronic Tongue as a Discrimination Tool of Water-Food Indicator/Contamination Bacteria" LINK
Agriculture NIR-Spectroscopy Usage
"Near infrared spectroscopy of plantation forest soil nutrients in Sabah, Malaysia, and the potential for microsite assessment" LINK
"Beverages : Physicochemical Changes Occurring during Long-Time Fermentation of the Indigenous Alcoholic Sorghum-Based Beverages Brewed in Northern Cameroon" LINK
"Leveraging Computer Vision for Applications in Biomedicine and Geoscience" | LINK
"Dietary Patterns and the Risk of Inflammatory Bowel Disease: Findings from a Case-Control Study" Nutrients LINK
"Soil Nutrient and Vegetation Diversity Patterns of Alpine Wetlands on the Qinghai-Tibetan Plateau" Sustainability LINK
"Assessment of Soil Quality under Different Soil Management Strategies: Combined Use of Statistical Approaches to Select the Most Informative Soil Physico-Chemical Indicators" Applied Sciences LINK
"Nondestructive phenotyping fatty acid trait of single soybean seeds using reflective hyperspectral imagery" LINK
Horticulture NIR-Spectroscopy Applications
"Neural Network based Prediction of Soluble Solids Concentrationin Oriental Melon using VIS/NIR spectroscopy" LINK
Food & Feed Industry NIR Usage
"Nondestructive identification of barley seeds varieties using hyperspectral data from two sides of barley seeds" LINK
"The effect of cryogrinding and size separation on bioactive profile of buckwheat hulls" LINK
"Vis-NIR spectroscopic and chemometric models for detecting contamination of premium green banana flour with wheat by quantifying resistant starch content" LINK
Other
"Sustainability : The Role of Co-Creating Value and Its Outcomes in Higher Education Marketing" LINK
"Multitechnique characterization of glass mosaic tesserae from Villa di Teodorico in Galeata (Italy)" LINK
"Controlled pDNA Release in Gemini Cationic Lipoplexes by Femtosecond Laser Irradiation of Gold Nanostars" LINK
"Random Lasing Detection of Mutant Huntingtin Expression in Cells" Sensors LINK
"Multi-sensors data fusion approach for site-specific seeding of consumption and seed potato production" | LINK
It’s easy to use with NIR-Predictor,
just drag & drop your data for getting the prediction results.
It supports an automatic file format detection.
So you don’t need to specify the instrument type and settings! See the list of supported formats and NIR Vendors: NIR-Predictor supported Spectral Data File Formats
Use the included data to checkout how it feels:
Open the demo Spectra folder by using the Menu > Open Demo Spectra or press F8.
There are files with spectra from different Vendors.
Drag & drop a spectra file onto the NIR-Predictor window (or press Ctrl+O as for ’Open some files).
The spectra will be
loaded
pre-processed
predicted and
reported
Note:
All the steps are fully automatic.
All calibrations that are compatible with the spectra, will produce prediction results in one go.
To select specific calibrations choose the Application. Where the " " empty means use all the calibrations.
To define a Application read more in chapter “Applications”
Hint:
To get access to Statistics of Predictions and Reports use the Menu > Show more/less (Ctrl+M) or you can simply resize the window. Here you can also re-do the Analyze step manually with changed inputs (e.g. Result Ordering).
Creating your own Calibrations
How it works - step by step
You have measured your samples with you NIR-Instrument Software.
And got the Lab-values of these samples.
Note: If you combined these data already in your NIR software used,
and you can export it as a JCAMP-DX file then use
Menu > Create Request File .req ... (F2)
and read the “Help.html” and NIR-Predictor JCAMP.
Else proceed as below.
The NIR-Predictor provides tooling for that:
Menu > Create Properties File... (F6)
Select the folder with your NIR spectra measured for an application.
NIR-Predictor creates a customized Properties file template for that data to enter the Lab values.
Note: You don’t need to specify your instrument or vendor or an application. It’s all done automatically. And also the sample spectra are detected and grouped automatically!
Use your favorite editor or spreadsheet program to enter and copy&paste
the Lab-references Values into the columns “Prop1”, “Prop2” etc. and save the file.
A final check of your entered data is done by NIR-Predictor,
to make sure your data ist complete and all is fine.
Menu > Create Calibration Request... (F7)
Select the folder with the filled file.
A CalibrationRequest.zip is created with the necessary data
if enougth diverse Lab values are entered.
Email the CalibrationRequest.zip file
to info@CalibrationModel.com to develop the calibrations.
When your calibrations are ready, you will receive an email with a link
to the CalibrationModel WebShop where
you can purchase and download the calibration files,
that work with our free NIR-Predictor software without internet access.
Note: Your sent NIR data is deleted after processing.
We do not collect your NIR data!
Note: Further details can be found under “Create Properties File” and “Create Calibration Request”.
Configure the Calibrations for prediction usage
Configuration:
in NIR-Predictor : Menu > Open Calibrations (F9)
an explorer window is opened where the calibrations are located
create a folder for your application, choose a name
copy the calibration file(s) (*.cm) into that folder
in NIR-Predictor : Menu > Search and load Applications (F4)
Usage:
in NIR-Predictor : open the Application drop down list, and select your application by name
if all is fine, the calibration file is valid and not expired, it shows : Calibration “1 valid calibation”
the NIR-Predictor is now ready to predict
to switch the application, goto 6.
Applications
The Application concept allows to group multiple Calibrations together for an Application. By selecting an Application before prediction, only the Calibrations belonging to the Application will be used for Prediction. In the Demo Data this is used to have multiple spectrometer as Application. This can be used easily as e.g. as Application “Meat Products” containing Fat and Moisture Calibration.
To create an Application, create a folder with the Application’s name inside the Calibrations folder, and move/copy all the Calibrations files to this Application folder. To remove a Calibration from the Application, remove the Calibration file from the Application folder.
After creating an new Application folder, press menu Search and load Applications (F4) to update the NIR-Predictor dialog where the Application can be selected via the dropdown list. You don’t need to close the NIR-Predictor.
After moving Calibration files around, press menu Search and load Calibrations (F5) to update the NIR-Predictor dialog.
The use-all case
In the NIR-Predictor dialog where the Application can be selected via the dropdown list, the empty "" name means that all (yes all) valid Calibrations will be used for prediction.
Note: The Prediction Report will contain only results from spectral compatible Calibrations with the given spectra. That allows to automatically handle the multi vendor NIR instrument usage.
Prediction Result Report
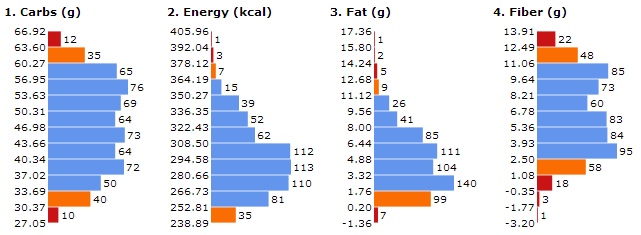
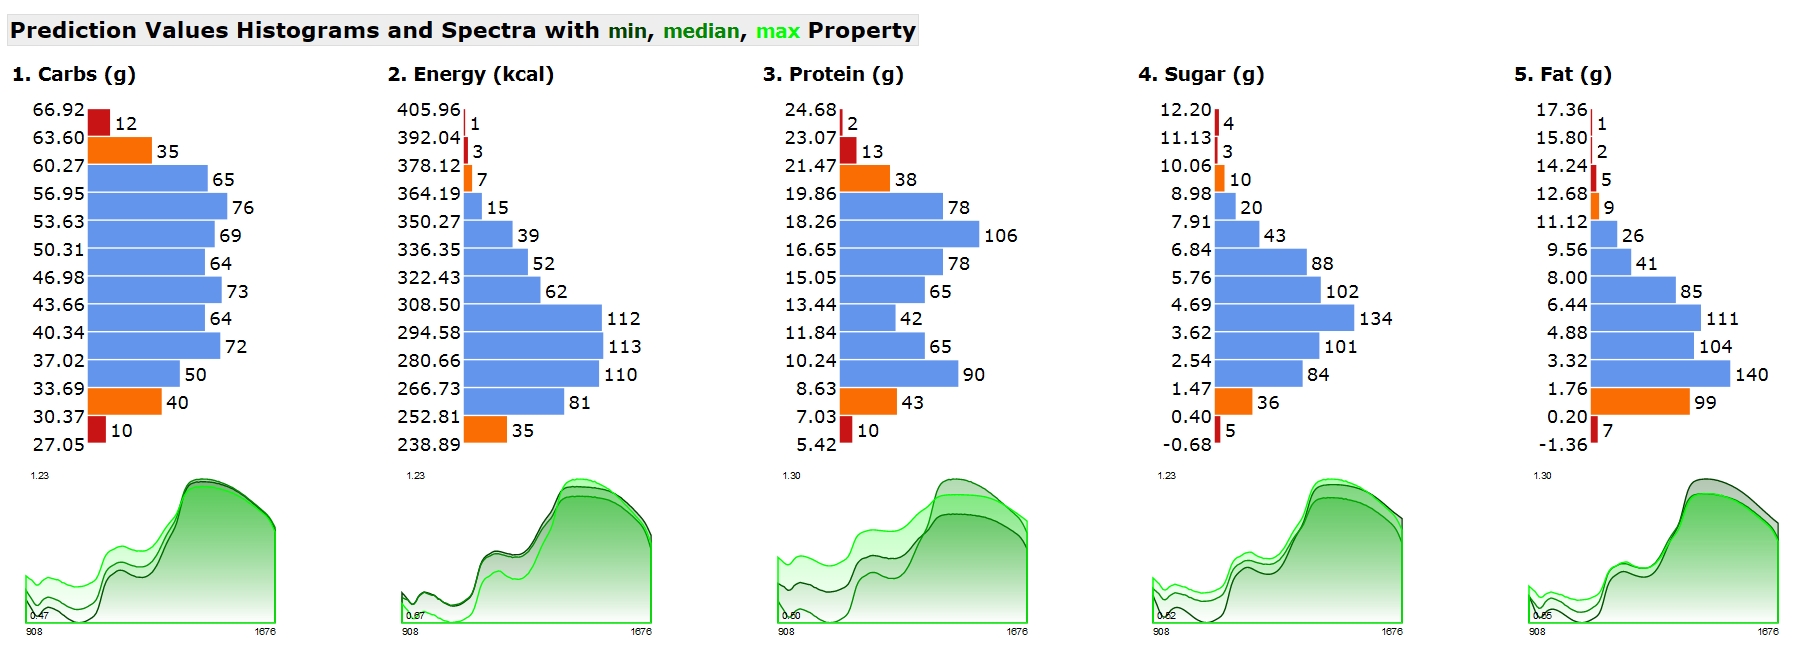
Histograms of Prediction Values per Property
Shows the distribution of the predicted results per calibration. The histogram range contains the range of the calibrated property and includes the predicted results.
The histogram bar (bin) color is defined as follow:
blue : all predictions inside calibration range.
red : all predictions outside calibration range.
orange : some overlaps with calibration range.
So not all spectra in a orange bin are outside calibration range.
Histograms
Note: Predicted values are always shown in Histogram table and Prediction Value List table, even if the spectrum does not fit into model (spectrum different to model, aka Residual Outlier) shown as Out = X.
Note: Old browsers like Microsoft Internet Explorer 11 don’t support the grafics for Histogram charts. Use an current browser like Firefox or Chrome or Edge.
Note: If your browser opens the report too slow, try to deactivate some browser plugins, because they can filter what you look at and some add-ons are really slow.
Spectra Plot Thumbnail on the Prediction Report
Visualizes the min,median,max spectrum of the spectra dropped as files on the NIR-Predictor. This gives a minimal and good spectral overview of the predicted property results.
Spectra Plot color legend: min,median,max spectrum by predicted property or if no calibration is available by spectral intensity.
The min,median,max is determined from the predicted properties or if not available from the intensity of the spectra.
Beside the histogram of the predicted properties, where the distribution can be seen, the spectra shown are the ones from min,median,max predicted property.
This gives a minimal and good spectral overview of the predicted property results.
The “Spectral Range” and number of datapoints is shown in the Prediction Report Header below the listed spectra files.
To zoom the spectra plot a little, zoom the report in the browser (hold ctrl + mouse wheel, or pinch on touch screen).
The spectra plots and histograms are stored with the report and can be archived.
Note
Note that the spectra are shown in the raw values that are loaded, they are not shown pre-processed as the calibration model uses them to make the prediction.
Note that the median property spectrum is the median from the predicted property pobulation and not the “median” of the calibration property range.
Note that in the multi calibration prediction case, the spectra are selected for each property based on the related predicted property values and so the spectra plots shows typical different spectra.
Spectra Plot
Outlier Detection
To safeguard the prediction results, outliers are automatically checked for each individual prediction. This is based on limits that are determined when creating the calibration with the base data. Thus, a strange spectral measurement can be detected and signaled as an outlier even without base data only by means of the calibration and the NIR predictor. A prediction result with outlier warning is to be distrusted. How the various outlier tests are interpreted and how to avoid them in practice is described here.
The spectrum is an outlier to the model, if the spectrum is not similar with the spectra and lab-values the model is built with.
This legend is shown on each NIR-Predictor prediction report below the results:
Outlier (Out) Symbol Description
“X” : spectrum does not fit into model (spectrum different to model)
“O” : spectrum is wide outside model center (spectrum similar to model but far away)
“=” : prediction is outside upper or lower range of model (property outside model range)
“-” : spectrum is incompatible to calibration
Note: A prediction result with outlier warning is to be distrusted.
There are 3 outlier cases (X, O, =) and the incompatible data case “-”.
The bad case is “X”
the medium case is “O”
and the soft case is “=”.
The technical names in literature correspond to:
“X” : Spectral Residual Outlier
“O” : Leverage Outlier
“=” : Property Range Outlier
These 3 outlier cases can appear in combinations, like “XO=” or “XO” or “O=” or “X=”. The more outlier marker are shown the more likely the spectrum is an Outlier.
The default setting in NIR-Predictor Menu > “Report with Simplified Outlier Symbols”
is ON, that will show only the worst case instead of all combinations to have a simplified minimal information.
if OFF, that will show the combinations (e.g. “XO=” or “XO” or “O=” or “X=”), which is more informative for analyzing problem cases.
Some hints to avoid these Outliers:
“X” : spectrum does not fit into model (spectrum different to model)
Check if the spectrum is noise only, or has no proper signal. That can happen when measured past the sample or measured into the air or at a different substance. If you have multiple NIR instruments of the same type, use spectra measured with different instruments for the calibration.
“O” : spectrum is wide outside model center (spectrum similar to model but far away) Sample temperature has an effect on NIR spectra shape, use spectra measured at different (typical use) temperatures (sample temperature, instrument temperature).
“=” : prediction is outside upper or lower range of model (property outside model range)
Use more spectra for the calibration in the Lab value region where your special interest is. If the predicted value is only a little bit out of the calibration range, it can be Ok. Add these spectra to the calibration spectra (with the Lab values), to extend the prediction range of the calibration.
“-” : spectrum is incompatible to calibration
The spectra (from the NIR instrument) has a different wavelength range or a different resolution than the spectra used for calibration. Check Instrument settings (wavelength range, resolution)
Result Ordering
To change the ordering, a drop-down-box is located below the Analyze button. If there is an analysis from the current session, and the Result Ordering is changed, the data is re-Analyzed and reported with the new Result Ordering setting. That allows to compare the different orderings. The Result Ordering is listed in the Prediction Report above the Prediction Value List and stored in the settings.
The order/sorting of the prediction results of the spectra can be defined:
GivenOrder (default) the given order of the spectra from file select dialog or drag&drop
*) sorted : ascending sort
Date_Name sorted by Date (if any) and then by Name
Name_Date sorted by Name and then by Date
Date_NamesWithNumbers sorted by Date (if any) and then by Name with number logic
NamesWithNumbers_Date sorted by Name with number logic (e.g. “ABC1” is before “ABC002” ) and then by Date
*) as above but sorted Rev : reverse sort = descending sort
Rev_Date_Name
Rev_Name_Date
Rev_Date_NamesWithNumbers
Rev_NamesWithNumbers_Date
E.g. with reverse sort by Rev_Date_Name, the newest spectra appear on top.
Print to PDF
Depending on how many calibrations are used the result table is getting broader. To print the report (e.g. to Adobe PDF, FreePDF or Microsoft XPS), sometimes the landscape format is shorter in number of pages or in portrait a scale of 80% fits nicely. Or try another internet browser (Mozilla Firefox, Google Chrome, Microsoft Edge, …) to print the report and set the browser as your default browser so it will be opened by default.
Archiving Reports
Each report is contained in one file only, including the grafics. To save storage space the report file folder can be compressed to a zip file (.zip, .7z).
Enter lab values to NIR spectra
Entering the laboratory reference values for NIR calibrations
We have developed specialized tools into NIR-Predictor to combine the NIR and Lab data is a sample-based safe manner.
The main target is to improve Data Quality during the step of combining of the Lab data and the NIR data, because to model a good reliable calibration the data that build the base needs to be of high quality.
It also simplifies to enter the lab values manually to the corresponding NIR data, because of automatically grouping repeated NIR measurements of the same sample, so the lab values can be entered sample based and not by spectrum.
It helps to avoid false reference data, because of the broken relation of NIR spectra and reference values, data entry on the wrong position in the table.
And Helps to detect errors of duplicated or multiple copies of spectra files, and checks for inconsistencies in Date-Time and Sample-Naming. It also checks for missing values.
That all increases the Data Quality for the next step of Calibration Development, and makes data entry a less time consuming and less risky work.
How it works
Menu > Create Properties File... (F6) select the folder with your NIR spectra measured for an application. NIR-Predictor creates a Properties file template for that data : PropertiesBySamples.csv.txt
Use your favorite editor or spreadsheet program to enter and copy&paste the Lab Values into the columns and save the file.
Menu > Create Calibration Request... (F7) select the folder with the filled file for a last check and a Calibration Request file is created with the needed data as a single zip file.
Email the Calibration Request file to info@CalibrationModel.com to develop the calibrations.
Ok that is it, the NIR-Predictor guides you through the steps needed. And if you need to know more details, the Chapter “Create Properties File” is for you.
Create Properties File
Note:
If you have (exported) JCAMP-DX files containing the Lab-Values, you don’t need to do this step.
You can send the JCAMP file with your Request (.req) file directly to the calibration service at info@CalibrationModel.com.
If your JCAMP-DX files does NOT contain Lab-Values, this is a way to go.
For calibrating the spectra to the lab-values you need to assign the lab-values to the spectra. The easiest way is to have a table where each spectrum (row) is linked to multiple lab-values (columns). This function Create Properties File build such a table for the selected spectra folder automatically!
This table is stored in the file PropertiesBySamples.csv.txt. This can be created for any spectra folder you like. The file extension is .csv.txt to make it easy to edit in a text editor and also in a spreadsheet (excel). The columns are standard TAB separated.
Prop1, Prop2, Prop3 are the place to enter the Lab Reference Concentrations properties corresponding to each spectrum. It can be extended to Prop4, Prop5, … etc. Of course you can enter real word names like “Fat (%)” instead of “Prop1”. It’s recommended to put the measurement unit beside the name.
Replicates is the number of replicated or repeated spectra of a sample that is grouped together in the Sample based property file. Sample name and the DateFirst / DateLast between the sample spectra are measured.
Date format is ISO-8601. Missing Dates are 0002-02-02T00:00:00.0000000.
If the file PropertiesBySamples.csv.txt already exist in the selected folder, the user will be notified (it will not be overwritten, because the file may contain user entered Lab-values). The Lab Reference Concentrations values are initialized to 0 (zero) and needed to be changed.
Note: 0 is not interpreted as missing value! If you have a 0 concentration value, put in 0 or 0.0 .
The entry of properties is as easy as possible, because it’s organized by Sample (and not by Spectra), so it’s like your Lab-Value Table that is sample based. The sample rows are sorted in a special way by Sample name. Sorting by Date or alphabetically by Sample can done easily in a spreadsheet program.
Note: when coping lab values to the samples make sure they correspond, so that there are no gaps and the sorting is the same.
The Spectra (rows) are initially sorted by name (and date) to have the replicates/repeats together. You can sort for your convenience in a spreadsheet program.
Enter the Lab Reference Concentrations to the spectra/sample.
Enter the Lab-Values in spreadsheet (e.g. Excel) or a text editor (e.g. Notepad++). If done, use the next menu Create Calibration Request.
Hints: Data handling:
The NIR-Predictor creates the PropertiesBySamples.csv.txt once, after that the user is responsible for its content. That means NIR-Predictor does not change this file anymore.
You can remove entire rows (spectra) in the property file. You don’t need to remove the spectra files. The NIR-Predictor is aware of the relation, the PropertiesBySamples.csv.txt defines what will be calibrated.
How to add more spectra files?
The additional spectra can be handled in a separate folder, create the property file and copy the spectra to the other folder and copy/merge the property files together in your editor or spreadsheet.
Or
Copy the spectra into the folder, rename the PropertiesBySamples.csv.txt to e.g. “PropertiesBySamples-Part1.csv.txt” and use Create Properties File to create a new PropertiesBySamples.csv.txt with all the spectra. You can copy/merge the content of the Properties files together in your editor or spreadsheet.
What happens with possible duplicate rows? It does no harm to the Calibration because we do an exact checking and data cleaning in the calibration process.
What happens to duplicate spectra names? The spectra names are not relevant for the calibration process. The spectra names are helpful to assign the lab-values to the corresponding spectrum entry. That’s why the table is initially sorted by name. The spectra names can be edited by the user.
Create Calibration Request
The menu function Create Calibration Request packs a created Properties file (see “Create Properties File”) and it’s linked spectra files in a compressed ZIP file for sending to the CalibrationModel.com Service.
Please note that the number of measured quantitative samples need to be at least 60 . That means you need at least 60 different spectra (not counting the replicate/repeated measurements).
It shows additional property information about the data you have entered, like - the property type (Quantitative) - it’s range (min - max) and - the number of unique values and - if the Lab-values are enough diverse to get calibrated.
First select the folder with the PropertiesBySamples.csv.txt and measured spectra files of samples you have Lab-values. The data is checked and you get notified what is missing or might be wrong. If something needs to be changed, edit the PropertiesBySamples.csv.txt and do Create Calibration Request again. Your last selected folder is remembered, so you can press return in the folder selection dialog.
Hint: The keyboard shortcuts for redoing it after you edited some entries is : F7 Return - that allows you to get the property information quickly.
Hint: If you open the PropertiesBySamples.csv.txt in a spreadsheet program, you can create Histogram plots of the entered Lab-values, to see in which range are to less samples measurements.
When all is fine
When all is fine the “CalibrationRequest.zip” file is created for that data.
The ZIP file contains:
your PropertiesBySamples.csv.txt
your personal REQuest file for your computer system, that looks like
e.g. “337dcdc06b2d6dfb0b5c4bba578642312edf2ae84d909281624d7e26283e8b07 WIN-GB0PB48GSK4.req”
the spectra data files
Note: If the CalibrationRequest.zip file is already created and you change the PropertiesBySamples.csv.txt make sure to delete the old CalibrationRequest.zip file first! In the dialog it states if it was successfully created or NOT because it already exist. So you are always on the safe side.
Note:CalibrationRequest.zip file name contains the property names to know what would be calibrated and at the end an identification number for referencing the file. E.g. “CalibrationRequest ‘Prop1’ - ‘Prop2’ h31T3wOH.zip”
Program Settings
The users program settings are stored in UserSettings.json
The program counters are stored in GlobalCounters.json
Beside the free NIR-Predictor software with Windows user interface,
the real-time Predictor Engine is also available
for embedded integration in application, cloud and instrument-software (ICT).
As a light-weigt single library file (DLL) with application programming interface (API),
documentation and software development kit (SDK)
including sample source code (C#).
Easy integration and deployment,
no software license protection (no serial key, no dongle).
Put your spectrum as an array into the multivariate predictor,
no specific file format needed.
Fast prediction speed and low latency because of compiled code library (direct call, no cloud API).
Protected prediction results with outlier detection information.
Minimal System Requirements
Windows 7 Starter 32Bit, 1.6 GHz, 2 GB RAM, non-Administrator account
Installation
There are no administrator rights required,
unpack the zip file to a folder "NIR-Predictor" in your documents or on your desktop.
Read the ReadMe.txt and double click the NIR-Predictor.exe file.
Upgrade
If you have installed an older version of NIR-Predictor then unpack into a different folder named e.g. "NIR-PredictorVx.y".
All versions can run side-by-side. Copy the Calibrations in use to the new version into the "Calibration" folder. That's all.
Uninstall
Make sure to backup your reports and calibrations inside your "NIR-Predictor" folder.
Delete the "NIR-Predictor" folder.
Neben der kostenlosen NIR-Predictor-Software mit Windows-Benutzeroberfläche
ist die Echtzeit-Predictor-Engine auch verfügbar
für die eingebettete Integration in Applikations-, Cloud- und Geräte-Software (ICT).
Als leichtgewichtige Einzelbibliotheksdatei (DLL)
mit Anwendungsprogrammier-Schnittstelle (API),
Dokumentation und Software Development Kit (SDK)
inklusive Beispiel-Quellcode (C#).
Einfache Integration und Bereitstellung,
kein Software-Lizenzschutz (kein Serienschlüssel, kein Dongle).
Geben Sie Ihr Spektrum als Array in den multivariaten Prädiktor ein,
es ist kein spezielles Dateiformat erforderlich.
Schnelle Vorhersagegeschwindigkeit und niedrige Latenz aufgrund der kompilierten Code-Bibliothek (direkter Aufruf, keine Cloud-API).
Geschützte Vorhersageergebnisse mit Informationen zur Ausreißererkennung.
Minimal System Requirements
Windows 7 Starter 32Bit, 1.6 GHz, 2 GB RAM, non-Administrator account
Installation
There are no administrator rights required,
unpack the zip file to a folder "NIR-Predictor" in your documents or on your desktop.
Read the ReadMe.txt and double click the NIR-Predictor.exe file.
Upgrade
If you have installed an older version of NIR-Predictor then unpack into a different folder named e.g. "NIR-PredictorVx.y".
All versions can run side-by-side. Copy the Calibrations in use to the new version into the "Calibration" folder. That's all.
Uninstall
Make sure to backup your reports and calibrations inside your "NIR-Predictor" folder.
Delete the "NIR-Predictor" folder.
Oltre al software gratuito NIR-Predictor con interfaccia utente Windows,
il Predictor Engine in tempo reale è disponibile anche
per l'integrazione embedded in applicazioni, cloud e strumenti-software (ICT).
Come un singolo file di libreria leggera (DLL)
con interfaccia di programmazione dell'applicazione (API),
documentazione e kit di sviluppo del software (SDK)
incluso il codice sorgente di esempio (C#).
Facile integrazione e distribuzione,
nessuna protezione della licenza software (nessuna chiave seriale, nessun dongle).
Inserisci il tuo spettro come array nel predittore multivariato,
non è necessario alcun formato di file specifico.
Velocità di predizione veloce e bassa latenza grazie alla libreria di codice compilata (chiamata diretta, nessuna API cloud).
Risultati di predizione protetti con informazioni di rilevamento degli outlier.
Minimal System Requirements
Windows 7 Starter 32Bit, 1.6 GHz, 2 GB RAM, non-Administrator account
Installation
There are no administrator rights required,
unpack the zip file to a folder "NIR-Predictor" in your documents or on your desktop.
Read the ReadMe.txt and double click the NIR-Predictor.exe file.
Upgrade
If you have installed an older version of NIR-Predictor then unpack into a different folder named e.g. "NIR-PredictorVx.y".
All versions can run side-by-side. Copy the Calibrations in use to the new version into the "Calibration" folder. That's all.
Uninstall
Make sure to backup your reports and calibrations inside your "NIR-Predictor" folder.
Delete the "NIR-Predictor" folder.