Spectroscopy and Chemometrics/Machine-Learning News Weekly #7, 2023

Get the Spectroscopy and Chemometrics News Weekly in real time on Twitter @ CalibModel and follow us.

NIR Calibration-Model Services

Spectroscopy and Chemometrics News Weekly 6, 2023 | NIRS NIR Spectroscopy MachineLearning Spectrometer Spectrometric Analytical Chemistry Chemical Analysis Lab Labs Laboratories Laboratory Software IoT Sensors QA QC Testing Quality LINK

Near-Infrared Spectroscopy (NIRS)

“Spectral Camouflage Characteristics and Recognition Ability of Targets Based on Visible/Near-Infrared Hyperspectral Images” LINK

“Development of a Near-Infrared Spectroscopy (NIRS)-Based Characterization Approach for Inherent Powder Blend Heterogeneity in Direct Compression …” | LINK

“Near-infrared spectroscopy based monitoring of all 20 amino acids in mammalian cell culture broth” LINK

“Identification of aged-rice adulteration based on near-infrared spectroscopy combined with partial least squares regression and characteristic wavelength …” LINK

” … of Brassica napus Varieties using Visible and Near-infrared (Vis-NIR) Spectroscopy Discrimination of canola varieties using Vis-NIR spectroscopy” LINK

“Sensors : Using Fuzzy Logic to Increase Accuracy in Mango Maturity Index Classification: Approach for Developing a Portable Near-Infrared Spectroscopy Device” | LINK

“Near Infrared Spectroscopy is not a Surrogate of Venous Occlusion Plethysmography to Assess Microvascular Resting Blood Flow and Function” LINK

“Recent Advances and Design Strategies Towards Wearable Near-infrared Spectroscopy” LINK

“Simulated Spectral Strategy to Enhance Numerical Tobacco Blending Based on Near-Infrared (NIR) Diffuse Reflectance Spectroscopy and Calibration Transfer” LINK

“Rapid evaluation method of eating quality based on near-infrared spectroscopy for composition and physicochemical properties analysis of rice grains” | LINK

“Portable NIR Spectroscopy-Chemometric Identification of Chemically Differentiated Yerba Mate (Ilex paraguariensis) Clones” | LINK

“Rapid determination of chemical components and antioxidant activity of the fruit of Crataegus pinnatifida Bunge by NIRS and chemometrics” LINK

“Quinoid conjugated polymer nanoparticles with NIRII absorption peak toward efficient photothermal therapy” LINK

Infrared Spectroscopy (IR) and Near-Infrared Spectroscopy (NIR)

“Optimizing extraction solvents for deoxynivalenol analysis in maize via infrared attenuated total reflection spectroscopy and chemometric methods” | LINK

Raman Spectroscopy

“Chemosensors : SERS-TLC Device for Simultaneous Determination of Sulfamethoxazole and Trimethoprim in Milk” | |(02)00329-1 LINK

Hyperspectral Imaging (HSI)

” THE USE OF RGB AND HYPERSPECTRAL IMAGING IN DETECTION OF CODLING MOTH AND ITS DAMAGES ON APPLE” LINK

“A Hyperspectral and RGB Dataset for Building Facade Segmentation” LINK

“Hyperspectral measurement technique based rapid determination of coal quality parameters of Jharia and Raniganj basin coal” LINK

“Hyperspectral technique combined with stacking and blending ensemble learning method for detection of cadmium content in oilseed rape leaves” LINK

Chemometrics and Machine Learning

“Non-destructive quality determination of frozen food using NIR spectroscopy-based machine learning and predictive modelling” | LINK

“Nutrients : Analysis of White Mulberry Leaves and Dietary Supplements, ATR-FTIR Combined with Chemometrics for the Rapid Determination of 1-Deoxynojirimycin” | LINK

“Assessment of energy content of industrial woodchip based on prediction models of moisture content using portable NIR spectrophotometer” LINK

“Application of wavelength selection strategy based on SWCSS-UVE algorithm in improving model transfer for near infrared analysis of holocellulose and lignin” LINK

“Remote Sensing : Modelling the Dynamics of Carbon Storages for Pinus densata Using Landsat Images in Shangri-La Considering Topographic Factors” | LINK

Equipment for Spectroscopy

“Prediction Method of the Moisture Content of Black Tea during Processing Based on the Miniaturized Near-Infrared Spectrometer” | LINK

“Polymers : Mechanism of Morphology Development in HDGEBA/PAMS Hybrid Thermosets: Monte Carlo Simulation and LSCM Study” | LINK

Process Control and NIR Sensors

“Neuromonitoring in neonatal critical care part I: neonatal encephalopathy and neonates with possible seizures” | LINK

Environment NIR-Spectroscopy Application

“Remote Sensing : Ultra-High-Resolution UAV-Based Detection of Alternaria solani Infections in Potato Fields” | LINK

Agriculture NIR-Spectroscopy Usage

“In Situ Digestibility and Nutritive Value of Inoculated Cool-Season Annual Grass Baleage” LINK

Food & Feed Industry NIR Usage

“Foods : Untargeted Profiling and Differentiation of Volatiles in Varieties of Meat Using GC Orbitrap MS” LINK

Other

“Cdq2 nanorods capped with CTAB and SLS: amalgamation, investigations for optoelectronic applications” | LINK

Spectroscopy and Chemometrics Machine-Learning News Weekly #38, 2022Spektroskopie und Chemometrie Machine-Learning News Wöchentlich #38, 2022Spettroscopia e Chemiometria Machine-Learning Weekly News #38, 2022

NIR Calibration-Model Services

Spectroscopy and Chemometrics News Weekly 37, 2022 | NIRS NIR Spectroscopy MachineLearning Spectrometer Spectrometric Analytical Chemistry Chemical Analysis Lab Labs Laboratories Laboratory Software IoT Sensors QA QC Testing Quality LINK


Near-Infrared Spectroscopy (NIRS)

"Geographical Discrimination of Ground Amazon Cocoa by Near-Infrared Spectroscopy: Influence of Sample Preparation" LINK

"Rapid assessment of enniatins in barley grains using near infrared spectroscopy and chemometric tools" LINK

"Sensors : Detection of Water pH Using Visible Near-Infrared Spectroscopy and One-Dimensional Convolutional Neural Network" LINK

"fNIRS-based brain state transition features to signify functional degeneration after Parkinson's disease" LINK

"Near-infrared spectroscopy of boulders with dust or patina coatings on the Moon: A two-layer radiative transfer model" LINK


Infrared Spectroscopy (IR) and Near-Infrared Spectroscopy (NIR)

"Discrimination of Gonipterini weevil genera using near infrared spectroscopy" LINK

"Mid-Infrared Serial Microring Resonator Array for Real-Time Detection of Vapor-Phase Volatile Organic Compounds" LINK


Raman Spectroscopy

"Labelfree SERS detection of prostate cancer combined with multivariate statistical algorithm" LINK


Hyperspectral Imaging (HSI)

"Determination of protein content in single black fly soldier (Hermetia illucens L.) larvae by near infrared hyperspectral imaging (NIR-HSI) and chemometrics" LINK

"Hyperspectral detection of walnut protein contents based on improved whale optimized algorithm" LINK

"Quantitative Inversion Model Design of Mine Water Characteristic Ions Based on Hyperspectral Technology" LINK

"Bloodstain Identification Based on Visible/Near-Infrared Hyperspectral Imaging with Convolutional Neural Network" LINK

"Uncertainty measurement-guided iterative sample selection via shallow convolutional neural network for hyperspectral image classification" LINK

"Two-dimensional granule property measurement using hyperspectral imaging in continuous pharmaceutical wet granulation" LINK

"Feasibility of identifying the authenticity of fresh and cooked mutton kebabs using visible and near-infrared hyperspectral imaging" LINK

"Nondestructive Quality Control in Powder Metallurgy using Hyperspectral Imaging" LINK

"Quality classification of kiwifruit under different storage conditions based on deep learning and hyperspectral imaging technology" LINK


Spectral Imaging

"Experimental Analysis of Tunable Optical Spectral Imaging System Using a Grating in the Pupil Function" LINK


Chemometrics and Machine Learning

"Monitoring the concentrations of Cd, Cu, Pb, Ni, Cr, Zn, Mn and Fe in cultivated Haplic Luvisol soils using near-infrared reflectance spectroscopy and chemometrics" LINK

"Application of Hyperspectral Technology Combined with Bat Algorithm-AdaBoost Model in Field Soil Nutrient Prediction" LINK

"Brazilian Canephora Coffee Evaluation Using Nir Spectroscopy and Discriminant Chemometric Techniques" LINK

"Rapid quantitative typing spectra model for distinguishing sweet and bitter apricot kernels" LINK

"Remote Sensing : Application of PLS-Augmented ANN Model for Retrieving Chlorophyll-a from Hyperspectral Data in Case 2 Waters of the Western Basin of Lake Erie" LINK

"Merging GIS and Machine Learning Techniques: A Paper Review" MachineLearning LINK

"CRISP-DM - Cross-Industry Standard Process for DataMining. It describes how DataAnalysts should start from business needs, mine the data, and deploy the model." | Data DataScience DataAnalysis DataAnalyst DataScientist LINK

"Survey of Machine Learning Lifecycle - Evolution of ML lifecycle from resource-constrained batch data mining to MLOps at the cloud scale." by LINK

"Interpretable and Explainable Machine Learning for Materials Science and Chemistry" MachineLearning MaterialScience Chemistry LINK

"Identification of Four Chicken Breeds by Hyperspectral Imaging Combined with Chemometrics" LINK

"Hyperspectral imaging and chemometrics assessment of intramuscular fat in pork Longissimus thoracic et lumborum primal cut" LINK

"Soil organic carbon (SOC) prediction in Australian sugarcane fields using Vis-NIR spectroscopy with different model setting approaches" LINK


Process Control and NIR Sensors

"Process Spectroscopy Market to be Worth $33.14 Billion by 2030: Grand View Research, Inc." LINK


Agriculture NIR-Spectroscopy Usage

"Quantitative inversion model of protein and fat content in milk based on hyperspectral techniques" LINK

"Influx of Near-Infrared Technology in Microplastic Community: A Bibliometric Analysis" LINK

"Remote Sensing : Mapping Seasonal Leaf Nutrients of Mangrove with Sentinel-2 Images and XGBoost Method" LINK


Food & Feed Industry NIR Usage

"Hyperspectral imaging combined with chemometrics for rapid detection of talcum powder adulterated in wheat flour" wheatflour LINK


Pharma Industry NIR Usage

"Rapid identification of polypeptide from carbapenemresistant and susceptible Escherichia coli via OrbitrapMS and pattern recognition analyses" LINK


Other

"Facile fabrication of binary BiOCl-Cu2CoSnS4 and ternary BiOCl-Cu2CoSnS4-TiO2 heterojunction nano photocatalyst for efficient sunlight-driven removal of direct ..." LINK

"Click chemically modified azobenzene derivatives and their third-order nonlinear optical properties" | LINK

"20 Antiaromatic Isophlorins without Metallation or Core Modification" LINK

"Three ytterbium (III) complexes with aromatic N‐donors: Synthesis, structure, photophysical properties and thermal stability" LINK

"Untargeted Region of Interest Selection for GC-MS Data using a Pseudo F-Ratio Moving Window" LINK

"Biosensors : Variational Mode Decomposition Weighted Multiscale Support Vector Regression for Spectral Determination of Rapeseed Oil and Rhizoma Alpiniae Offcinarum Adulterants" LINK


NIR Calibration-Model Services

Spektroskopie und Chemometrie Neuigkeiten Wöchentlich 37, 2022 | NIRS NIR Spektroskopie MachineLearning Spektrometer IoT Sensor Nahinfrarot Chemie Analytik Analysengeräte Analysentechnik Analysemethode Nahinfrarotspektroskopie Laboranalyse LINK


Near-Infrared Spectroscopy (NIRS)

"Geographical Discrimination of Ground Amazon Cocoa by Near-Infrared Spectroscopy: Influence of Sample Preparation" LINK

"Rapid assessment of enniatins in barley grains using near infrared spectroscopy and chemometric tools" LINK

"Sensors : Detection of Water pH Using Visible Near-Infrared Spectroscopy and One-Dimensional Convolutional Neural Network" LINK

"fNIRS-based brain state transition features to signify functional degeneration after Parkinson's disease" LINK

"Near-infrared spectroscopy of boulders with dust or patina coatings on the Moon: A two-layer radiative transfer model" LINK


Infrared Spectroscopy (IR) and Near-Infrared Spectroscopy (NIR)

"Discrimination of Gonipterini weevil genera using near infrared spectroscopy" LINK

"Mid-Infrared Serial Microring Resonator Array for Real-Time Detection of Vapor-Phase Volatile Organic Compounds" LINK


Raman Spectroscopy

"Labelfree SERS detection of prostate cancer combined with multivariate statistical algorithm" LINK


Hyperspectral Imaging (HSI)

"Determination of protein content in single black fly soldier (Hermetia illucens L.) larvae by near infrared hyperspectral imaging (NIR-HSI) and chemometrics" LINK

"Hyperspectral detection of walnut protein contents based on improved whale optimized algorithm" LINK

"Quantitative Inversion Model Design of Mine Water Characteristic Ions Based on Hyperspectral Technology" LINK

"Bloodstain Identification Based on Visible/Near-Infrared Hyperspectral Imaging with Convolutional Neural Network" LINK

"Uncertainty measurement-guided iterative sample selection via shallow convolutional neural network for hyperspectral image classification" LINK

"Two-dimensional granule property measurement using hyperspectral imaging in continuous pharmaceutical wet granulation" LINK

"Feasibility of identifying the authenticity of fresh and cooked mutton kebabs using visible and near-infrared hyperspectral imaging" LINK

"Nondestructive Quality Control in Powder Metallurgy using Hyperspectral Imaging" LINK

"Quality classification of kiwifruit under different storage conditions based on deep learning and hyperspectral imaging technology" LINK


Spectral Imaging

"Experimental Analysis of Tunable Optical Spectral Imaging System Using a Grating in the Pupil Function" LINK


Chemometrics and Machine Learning

"Monitoring the concentrations of Cd, Cu, Pb, Ni, Cr, Zn, Mn and Fe in cultivated Haplic Luvisol soils using near-infrared reflectance spectroscopy and chemometrics" LINK

"Application of Hyperspectral Technology Combined with Bat Algorithm-AdaBoost Model in Field Soil Nutrient Prediction" LINK

"Brazilian Canephora Coffee Evaluation Using Nir Spectroscopy and Discriminant Chemometric Techniques" LINK

"Rapid quantitative typing spectra model for distinguishing sweet and bitter apricot kernels" LINK

"Remote Sensing : Application of PLS-Augmented ANN Model for Retrieving Chlorophyll-a from Hyperspectral Data in Case 2 Waters of the Western Basin of Lake Erie" LINK

"Merging GIS and Machine Learning Techniques: A Paper Review" MachineLearning LINK

"CRISP-DM - Cross-Industry Standard Process for DataMining. It describes how DataAnalysts should start from business needs, mine the data, and deploy the model." | Data DataScience DataAnalysis DataAnalyst DataScientist LINK

"Survey of Machine Learning Lifecycle - Evolution of ML lifecycle from resource-constrained batch data mining to MLOps at the cloud scale." by LINK

"Interpretable and Explainable Machine Learning for Materials Science and Chemistry" MachineLearning MaterialScience Chemistry LINK

"Identification of Four Chicken Breeds by Hyperspectral Imaging Combined with Chemometrics" LINK

"Hyperspectral imaging and chemometrics assessment of intramuscular fat in pork Longissimus thoracic et lumborum primal cut" LINK

"Soil organic carbon (SOC) prediction in Australian sugarcane fields using Vis-NIR spectroscopy with different model setting approaches" LINK


Process Control and NIR Sensors

"Process Spectroscopy Market to be Worth $33.14 Billion by 2030: Grand View Research, Inc." LINK


Agriculture NIR-Spectroscopy Usage

"Quantitative inversion model of protein and fat content in milk based on hyperspectral techniques" LINK

"Influx of Near-Infrared Technology in Microplastic Community: A Bibliometric Analysis" LINK

"Remote Sensing : Mapping Seasonal Leaf Nutrients of Mangrove with Sentinel-2 Images and XGBoost Method" LINK


Food & Feed Industry NIR Usage

"Hyperspectral imaging combined with chemometrics for rapid detection of talcum powder adulterated in wheat flour" wheatflour LINK


Pharma Industry NIR Usage

"Rapid identification of polypeptide from carbapenemresistant and susceptible Escherichia coli via OrbitrapMS and pattern recognition analyses" LINK


Other

"Facile fabrication of binary BiOCl-Cu2CoSnS4 and ternary BiOCl-Cu2CoSnS4-TiO2 heterojunction nano photocatalyst for efficient sunlight-driven removal of direct ..." LINK

"Click chemically modified azobenzene derivatives and their third-order nonlinear optical properties" | LINK

"20 Antiaromatic Isophlorins without Metallation or Core Modification" LINK

"Three ytterbium (III) complexes with aromatic N‐donors: Synthesis, structure, photophysical properties and thermal stability" LINK

"Untargeted Region of Interest Selection for GC-MS Data using a Pseudo F-Ratio Moving Window" LINK

"Biosensors : Variational Mode Decomposition Weighted Multiscale Support Vector Regression for Spectral Determination of Rapeseed Oil and Rhizoma Alpiniae Offcinarum Adulterants" LINK


NIR Calibration-Model Services

Spettroscopia e Chemiometria Weekly News 37, 2022 | NIRS NIR Spettroscopia MachineLearning analisi chimica Spettrale Spettrometro Chem IoT Sensore Attrezzatura analitica Laboratorio analisi prova qualità Analysesystem QualityControl LINK


Near-Infrared Spectroscopy (NIRS)

"Geographical Discrimination of Ground Amazon Cocoa by Near-Infrared Spectroscopy: Influence of Sample Preparation" LINK

"Rapid assessment of enniatins in barley grains using near infrared spectroscopy and chemometric tools" LINK

"Sensors : Detection of Water pH Using Visible Near-Infrared Spectroscopy and One-Dimensional Convolutional Neural Network" LINK

"fNIRS-based brain state transition features to signify functional degeneration after Parkinson's disease" LINK

"Near-infrared spectroscopy of boulders with dust or patina coatings on the Moon: A two-layer radiative transfer model" LINK


Infrared Spectroscopy (IR) and Near-Infrared Spectroscopy (NIR)

"Discrimination of Gonipterini weevil genera using near infrared spectroscopy" LINK

"Mid-Infrared Serial Microring Resonator Array for Real-Time Detection of Vapor-Phase Volatile Organic Compounds" LINK


Raman Spectroscopy

"Labelfree SERS detection of prostate cancer combined with multivariate statistical algorithm" LINK


Hyperspectral Imaging (HSI)

"Determination of protein content in single black fly soldier (Hermetia illucens L.) larvae by near infrared hyperspectral imaging (NIR-HSI) and chemometrics" LINK

"Hyperspectral detection of walnut protein contents based on improved whale optimized algorithm" LINK

"Quantitative Inversion Model Design of Mine Water Characteristic Ions Based on Hyperspectral Technology" LINK

"Bloodstain Identification Based on Visible/Near-Infrared Hyperspectral Imaging with Convolutional Neural Network" LINK

"Uncertainty measurement-guided iterative sample selection via shallow convolutional neural network for hyperspectral image classification" LINK

"Two-dimensional granule property measurement using hyperspectral imaging in continuous pharmaceutical wet granulation" LINK

"Feasibility of identifying the authenticity of fresh and cooked mutton kebabs using visible and near-infrared hyperspectral imaging" LINK

"Nondestructive Quality Control in Powder Metallurgy using Hyperspectral Imaging" LINK

"Quality classification of kiwifruit under different storage conditions based on deep learning and hyperspectral imaging technology" LINK


Spectral Imaging

"Experimental Analysis of Tunable Optical Spectral Imaging System Using a Grating in the Pupil Function" LINK


Chemometrics and Machine Learning

"Monitoring the concentrations of Cd, Cu, Pb, Ni, Cr, Zn, Mn and Fe in cultivated Haplic Luvisol soils using near-infrared reflectance spectroscopy and chemometrics" LINK

"Application of Hyperspectral Technology Combined with Bat Algorithm-AdaBoost Model in Field Soil Nutrient Prediction" LINK

"Brazilian Canephora Coffee Evaluation Using Nir Spectroscopy and Discriminant Chemometric Techniques" LINK

"Rapid quantitative typing spectra model for distinguishing sweet and bitter apricot kernels" LINK

"Remote Sensing : Application of PLS-Augmented ANN Model for Retrieving Chlorophyll-a from Hyperspectral Data in Case 2 Waters of the Western Basin of Lake Erie" LINK

"Merging GIS and Machine Learning Techniques: A Paper Review" MachineLearning LINK

"CRISP-DM - Cross-Industry Standard Process for DataMining. It describes how DataAnalysts should start from business needs, mine the data, and deploy the model." | Data DataScience DataAnalysis DataAnalyst DataScientist LINK

"Survey of Machine Learning Lifecycle - Evolution of ML lifecycle from resource-constrained batch data mining to MLOps at the cloud scale." by LINK

"Interpretable and Explainable Machine Learning for Materials Science and Chemistry" MachineLearning MaterialScience Chemistry LINK

"Identification of Four Chicken Breeds by Hyperspectral Imaging Combined with Chemometrics" LINK

"Hyperspectral imaging and chemometrics assessment of intramuscular fat in pork Longissimus thoracic et lumborum primal cut" LINK

"Soil organic carbon (SOC) prediction in Australian sugarcane fields using Vis-NIR spectroscopy with different model setting approaches" LINK


Process Control and NIR Sensors

"Process Spectroscopy Market to be Worth $33.14 Billion by 2030: Grand View Research, Inc." LINK


Agriculture NIR-Spectroscopy Usage

"Quantitative inversion model of protein and fat content in milk based on hyperspectral techniques" LINK

"Influx of Near-Infrared Technology in Microplastic Community: A Bibliometric Analysis" LINK

"Remote Sensing : Mapping Seasonal Leaf Nutrients of Mangrove with Sentinel-2 Images and XGBoost Method" LINK


Food & Feed Industry NIR Usage

"Hyperspectral imaging combined with chemometrics for rapid detection of talcum powder adulterated in wheat flour" wheatflour LINK


Pharma Industry NIR Usage

"Rapid identification of polypeptide from carbapenemresistant and susceptible Escherichia coli via OrbitrapMS and pattern recognition analyses" LINK


Other

"Facile fabrication of binary BiOCl-Cu2CoSnS4 and ternary BiOCl-Cu2CoSnS4-TiO2 heterojunction nano photocatalyst for efficient sunlight-driven removal of direct ..." LINK

"Click chemically modified azobenzene derivatives and their third-order nonlinear optical properties" | LINK

"20 Antiaromatic Isophlorins without Metallation or Core Modification" LINK

"Three ytterbium (III) complexes with aromatic N‐donors: Synthesis, structure, photophysical properties and thermal stability" LINK

"Untargeted Region of Interest Selection for GC-MS Data using a Pseudo F-Ratio Moving Window" LINK

"Biosensors : Variational Mode Decomposition Weighted Multiscale Support Vector Regression for Spectral Determination of Rapeseed Oil and Rhizoma Alpiniae Offcinarum Adulterants" LINK


Spectroscopy and Chemometrics News Weekly #27, 2021Spektroskopie und Chemometrie Neuigkeiten Wöchentlich #27, 2021Spettroscopia e Chemiometria Weekly News #27, 2021

NIR Calibration-Model Services

Spectroscopy and Chemometrics News Weekly 26, 2021 | NIRS NIR Spectroscopy MachineLearning Spectrometer Spectrometric Analytical Chemistry Chemical Analysis Lab Labs Laboratories Laboratory Software IoT Sensors QA QC Testing Quality LINK

This week's NIR news Weekly is sponsored by Your-Company-Name-Here - NIR-spectrometers. Check out their product page ... link

Get the Spectroscopy and Chemometrics News Weekly in real time on Twitter @ CalibModel and follow us.


Near-Infrared Spectroscopy (NIRS)

"Modelling of the optical signature of oil slicks at sea for the analysis of multi-and hyperspectral VNIR-SWIR images" LINK

"Sensors : A Guide to Parent-Child fNIRS Hyperscanning Data Processing and Analysis" LINK

"Evaluation of Pozzolanic Activity of Metakaolin Chemometric Method According to the UV-VIS-NIR Spectroscopy" | LINK

"Determining the end-date of long-ripening cheese maturation using NIR hyperspectral image modelling: A feasibility study" LINK

"NIRResponsive Ti3C2 MXene Colloidal Solution for Curing Purulent Subcutaneous Infection through the Nanothermal Blade Effect" LINK

"On-line Powerplant Control using Near-InfraRed Spectroscopy: OPtiC-NIRS" LINK

"Maturity determination at harvest and spatial assessment of moisture content in okra using Vis-NIR hyperspectral imaging" LINK

"Predicting anemia using NIR spectrum of spent dialysis fluid in hemodialysis patients" | LINK

"Analysis methods for measuring passive auditory fNIRS responses generated by a block-design paradigm" LINK

"Boosting the generalization ability of Vis-NIR-spectroscopy-based regression models through dimension reduction and transfer learning" LINK


Infrared Spectroscopy (IR) and Near-Infrared Spectroscopy (NIR)

"Nondestructive determination of GABA in germinated brown rice with near infrared spectroscopy based on wavelet transform denoising" LINK

"Continuous downstream processing of milled electrospun fibers to tablets monitored by near-infrared and Raman spectroscopy" LINK

"Suitability of the muscle O2 resaturation parameters most used for assessing reactive hyperemia: a near-infrared spectroscopy study" LINK

"Fourier transform infrared spectroscopic analysis of organic archaeological materials: background paper" LINK

"Near infrared technique as a tool for the rapid assessment of waste wood quality for energy applications" LINK

"Research Note: Nondestructive detection of super grade chick embryos or hatchlings using near-infrared spectroscopy" LINK

"Fraud Detection in Batches of Sweet Almonds by Portable Near-Infrared Spectral Devices" LINK

"Contaminant detection in pistachio nuts by different classification methods applied to short-wave infrared hyperspectral images" LINK

"Prediction of fatty acid and mineral composition of lentils using near infrared spectroscopy" LINK

"Intact Macadamia Nut Quality Assessment Using Near-Infrared Spectroscopy and Multivariate Analysis" LINK

"Identification of Armeniacae Semen Amarum and Persicae Semen from different origins based on near infrared hyperspectral imaging technology" LINK

"Applicability of Raman and Near-infrared Spectroscopy in the Monitoring of freeze-drying injectable ibuprofen" LINK

"Monitoring Breast Reconstruction Flaps Using Near-Infrared Spectroscopy Tissue Oximetry" | LINK

"Prediction of Peking duck intra-muscle fat content by near-infrared spectroscopy" LINK


Hyperspectral Imaging (HSI)

"Combination of spectral and image information from hyperspectral imaging for the prediction and visualization of the total volatile basic nitrogen content in cooked ..." | LINK

"A Spectrum Extension Approach for Radiometric Calibration of the Advanced Hyperspectral Imager Aboard the Gaofen-5 Satellite" LINK

"Affinity between Bitumen and Aggregate in Hot Mix Asphalt by Hyperspectral Imaging and Digital Picture Analysis" "Coatings LINK


Chemometrics and Machine Learning

"Remote Sensing : Sentinel-1 and 2 Time-Series for Vegetation Mapping Using Random Forest Classification: A Case Study of Northern Croatia" LINK

"Calibration Maintenance Application of Near-infrared Spectrometric Model in Food Analysis" LINK

"Fast quantification of total volatile basic nitrogen (TVB-N) content in beef and pork by near-infrared spectroscopy: Comparison of SVR and PLS model" LINK

"Nutritive quality prediction of peaches during storage" LINK


Research on Spectroscopy

"Efficient Maize Tassel-Detection Method using UAV based Remote Sensing" LINK

"A Mini Review on Characteristics and Analytical Methods of Otilonium Bromide" LINK

"Design of an Innovative Methodology for Cerebrospinal Fluid Analysis: Preliminary Results" Sensors LINK

"Effect of Na doping on microstructures, optical and electrical properties of ZnO thin films grown by sol-gel method" LINK


Process Control and NIR Sensors

"Conjugated Organic Photothermal Films for Spatiotemporal Thermal Engineering" LINK

"Extended neuromonitoring in aortic arch surgery" | LINK


Agriculture NIR-Spectroscopy Usage

"Fostering soil sustainability and food safety in urban agricultural areas of Naples, Italy" LINK

"The Application of Near Infrared Reflectance Spectroscopy in Nutrient Ingredient Determination of Silage Maize" LINK

"Identification of soybean varieties based on hyperspectral imaging technology and onedimensional convolutional neural network" LINK

"Minerals, Vol. 11, Pages 576: Flow Properties Analysis and Identification of a Fly Ash-Waste Rock Mixed Backfilling Slurry" LINK

"Applied Sciences, Vol. 11, Pages 5023: Drying Stress and Strain of Wood: A Review" LINK

"Spectral analysis of total phosphorus in soils based on its diagnostic reflectance spectra" LINK


Horticulture NIR-Spectroscopy Applications

"Concurrent starch accumulation in stump and high fruit production in coffee (Coffea arabica)" LINK


Food & Feed Industry NIR Usage

"Foods : Potential Contribution of Climate Change to the Protein Haze of White Wines from the French Southwest Region" LINK

" Foods : Is the Consumer Ready for Innovative Fruit Wines? Perception and Acceptability of Young Consumers" LINK


Pharma Industry NIR Usage

"[ZITATION][C] Bilateral acute macular neuroretinopathy following COVID‐19 infection" LINK


Medicinal Spectroscopy

"Utility of Ultrasonographic Assessment of Distal Femoral Arterial Flow during Minimally Invasive Valve Surgery" LINK

"Revealing Inflammatory Indications Induced by Titanium Al-loy Wear Debris in Periprosthetic Tissue by Label-Free Correla-tive High-Resolution Ion, Electron ..." LINK


Laboratory and NIR-Spectroscopy

"Use of non-destructive instrumental techniques to evaluate effects of gamma irradiation, quality and sensory attributes in orange juice" LINK


Other

"Crossing the threshold: new insights on exercise thresholds and acute recovery from high-intensity exercise" LINK

"The polymeric glyco-linker controls the signal outputs for plasmonic gold nanorod biosensors due to biocorona formation" LINK

"近红外光谱传感物联网研究与应用进展" LINK

"Charge Transport in and Electroluminescence from sp<sup>3</sup>-Functionalized Carbon Nanotube Networks" LINK

"Unprecedented Thermal Stability of Plasmonic Titanium Nitride Films up to 1400 °C" LINK

"CopperBased Plasmonic Catalysis: Recent Advances and Future Perspectives" LINK


.
NIR Calibration-Model Services

Spektroskopie und Chemometrie Neuigkeiten Wöchentlich 26, 2021 | NIRS NIR Spektroskopie MachineLearning Spektrometer IoT Sensor Nahinfrarot Chemie Analytik Analysengeräte Analysentechnik Analysemethode Nahinfrarotspektroskopie Laboranalyse LINK

This week's NIR news Weekly is sponsored by Your-Company-Name-Here - NIR-spectrometers. Check out their product page ... link

Get the Spectroscopy and Chemometrics News Weekly in real time on Twitter @ CalibModel and follow us.


Near-Infrared Spectroscopy (NIRS)

"Modelling of the optical signature of oil slicks at sea for the analysis of multi-and hyperspectral VNIR-SWIR images" LINK

"Sensors : A Guide to Parent-Child fNIRS Hyperscanning Data Processing and Analysis" LINK

"Evaluation of Pozzolanic Activity of Metakaolin Chemometric Method According to the UV-VIS-NIR Spectroscopy" | LINK

"Determining the end-date of long-ripening cheese maturation using NIR hyperspectral image modelling: A feasibility study" LINK

"NIRResponsive Ti3C2 MXene Colloidal Solution for Curing Purulent Subcutaneous Infection through the Nanothermal Blade Effect" LINK

"On-line Powerplant Control using Near-InfraRed Spectroscopy: OPtiC-NIRS" LINK

"Maturity determination at harvest and spatial assessment of moisture content in okra using Vis-NIR hyperspectral imaging" LINK

"Predicting anemia using NIR spectrum of spent dialysis fluid in hemodialysis patients" | LINK

"Analysis methods for measuring passive auditory fNIRS responses generated by a block-design paradigm" LINK

"Boosting the generalization ability of Vis-NIR-spectroscopy-based regression models through dimension reduction and transfer learning" LINK


Infrared Spectroscopy (IR) and Near-Infrared Spectroscopy (NIR)

"Nondestructive determination of GABA in germinated brown rice with near infrared spectroscopy based on wavelet transform denoising" LINK

"Continuous downstream processing of milled electrospun fibers to tablets monitored by near-infrared and Raman spectroscopy" LINK

"Suitability of the muscle O2 resaturation parameters most used for assessing reactive hyperemia: a near-infrared spectroscopy study" LINK

"Fourier transform infrared spectroscopic analysis of organic archaeological materials: background paper" LINK

"Near infrared technique as a tool for the rapid assessment of waste wood quality for energy applications" LINK

"Research Note: Nondestructive detection of super grade chick embryos or hatchlings using near-infrared spectroscopy" LINK

"Fraud Detection in Batches of Sweet Almonds by Portable Near-Infrared Spectral Devices" LINK

"Contaminant detection in pistachio nuts by different classification methods applied to short-wave infrared hyperspectral images" LINK

"Prediction of fatty acid and mineral composition of lentils using near infrared spectroscopy" LINK

"Intact Macadamia Nut Quality Assessment Using Near-Infrared Spectroscopy and Multivariate Analysis" LINK

"Identification of Armeniacae Semen Amarum and Persicae Semen from different origins based on near infrared hyperspectral imaging technology" LINK

"Applicability of Raman and Near-infrared Spectroscopy in the Monitoring of freeze-drying injectable ibuprofen" LINK

"Monitoring Breast Reconstruction Flaps Using Near-Infrared Spectroscopy Tissue Oximetry" | LINK

"Prediction of Peking duck intra-muscle fat content by near-infrared spectroscopy" LINK


Hyperspectral Imaging (HSI)

"Combination of spectral and image information from hyperspectral imaging for the prediction and visualization of the total volatile basic nitrogen content in cooked ..." | LINK

"A Spectrum Extension Approach for Radiometric Calibration of the Advanced Hyperspectral Imager Aboard the Gaofen-5 Satellite" LINK

"Affinity between Bitumen and Aggregate in Hot Mix Asphalt by Hyperspectral Imaging and Digital Picture Analysis" "Coatings LINK


Chemometrics and Machine Learning

"Remote Sensing : Sentinel-1 and 2 Time-Series for Vegetation Mapping Using Random Forest Classification: A Case Study of Northern Croatia" LINK

"Calibration Maintenance Application of Near-infrared Spectrometric Model in Food Analysis" LINK

"Fast quantification of total volatile basic nitrogen (TVB-N) content in beef and pork by near-infrared spectroscopy: Comparison of SVR and PLS model" LINK

"Nutritive quality prediction of peaches during storage" LINK


Research on Spectroscopy

"Efficient Maize Tassel-Detection Method using UAV based Remote Sensing" LINK

"A Mini Review on Characteristics and Analytical Methods of Otilonium Bromide" LINK

"Design of an Innovative Methodology for Cerebrospinal Fluid Analysis: Preliminary Results" Sensors LINK

"Effect of Na doping on microstructures, optical and electrical properties of ZnO thin films grown by sol-gel method" LINK


Process Control and NIR Sensors

"Conjugated Organic Photothermal Films for Spatiotemporal Thermal Engineering" LINK

"Extended neuromonitoring in aortic arch surgery" | LINK


Agriculture NIR-Spectroscopy Usage

"Fostering soil sustainability and food safety in urban agricultural areas of Naples, Italy" LINK

"The Application of Near Infrared Reflectance Spectroscopy in Nutrient Ingredient Determination of Silage Maize" LINK

"Identification of soybean varieties based on hyperspectral imaging technology and onedimensional convolutional neural network" LINK

"Minerals, Vol. 11, Pages 576: Flow Properties Analysis and Identification of a Fly Ash-Waste Rock Mixed Backfilling Slurry" LINK

"Applied Sciences, Vol. 11, Pages 5023: Drying Stress and Strain of Wood: A Review" LINK

"Spectral analysis of total phosphorus in soils based on its diagnostic reflectance spectra" LINK


Horticulture NIR-Spectroscopy Applications

"Concurrent starch accumulation in stump and high fruit production in coffee (Coffea arabica)" LINK


Food & Feed Industry NIR Usage

"Foods : Potential Contribution of Climate Change to the Protein Haze of White Wines from the French Southwest Region" LINK

" Foods : Is the Consumer Ready for Innovative Fruit Wines? Perception and Acceptability of Young Consumers" LINK


Pharma Industry NIR Usage

"[ZITATION][C] Bilateral acute macular neuroretinopathy following COVID‐19 infection" LINK


Medicinal Spectroscopy

"Utility of Ultrasonographic Assessment of Distal Femoral Arterial Flow during Minimally Invasive Valve Surgery" LINK

"Revealing Inflammatory Indications Induced by Titanium Al-loy Wear Debris in Periprosthetic Tissue by Label-Free Correla-tive High-Resolution Ion, Electron ..." LINK


Laboratory and NIR-Spectroscopy

"Use of non-destructive instrumental techniques to evaluate effects of gamma irradiation, quality and sensory attributes in orange juice" LINK


Other

"Crossing the threshold: new insights on exercise thresholds and acute recovery from high-intensity exercise" LINK

"The polymeric glyco-linker controls the signal outputs for plasmonic gold nanorod biosensors due to biocorona formation" LINK

"近红外光谱传感物联网研究与应用进展" LINK

"Charge Transport in and Electroluminescence from sp<sup>3</sup>-Functionalized Carbon Nanotube Networks" LINK

"Unprecedented Thermal Stability of Plasmonic Titanium Nitride Films up to 1400 °C" LINK

"CopperBased Plasmonic Catalysis: Recent Advances and Future Perspectives" LINK


.
NIR Calibration-Model Services

Spettroscopia e Chemiometria Weekly News 26, 2021 | NIRS NIR Spettroscopia MachineLearning analisi chimica Spettrale Spettrometro Chem IoT Sensore Attrezzatura analitica Laboratorio analisi prova qualità Analysesystem QualityControl LINK

This week's NIR news Weekly is sponsored by Your-Company-Name-Here - NIR-spectrometers. Check out their product page ... link

Get the Spectroscopy and Chemometrics News Weekly in real time on Twitter @ CalibModel and follow us.


Near-Infrared Spectroscopy (NIRS)

"Modelling of the optical signature of oil slicks at sea for the analysis of multi-and hyperspectral VNIR-SWIR images" LINK

"Sensors : A Guide to Parent-Child fNIRS Hyperscanning Data Processing and Analysis" LINK

"Evaluation of Pozzolanic Activity of Metakaolin Chemometric Method According to the UV-VIS-NIR Spectroscopy" | LINK

"Determining the end-date of long-ripening cheese maturation using NIR hyperspectral image modelling: A feasibility study" LINK

"NIRResponsive Ti3C2 MXene Colloidal Solution for Curing Purulent Subcutaneous Infection through the Nanothermal Blade Effect" LINK

"On-line Powerplant Control using Near-InfraRed Spectroscopy: OPtiC-NIRS" LINK

"Maturity determination at harvest and spatial assessment of moisture content in okra using Vis-NIR hyperspectral imaging" LINK

"Predicting anemia using NIR spectrum of spent dialysis fluid in hemodialysis patients" | LINK

"Analysis methods for measuring passive auditory fNIRS responses generated by a block-design paradigm" LINK

"Boosting the generalization ability of Vis-NIR-spectroscopy-based regression models through dimension reduction and transfer learning" LINK


Infrared Spectroscopy (IR) and Near-Infrared Spectroscopy (NIR)

"Nondestructive determination of GABA in germinated brown rice with near infrared spectroscopy based on wavelet transform denoising" LINK

"Continuous downstream processing of milled electrospun fibers to tablets monitored by near-infrared and Raman spectroscopy" LINK

"Suitability of the muscle O2 resaturation parameters most used for assessing reactive hyperemia: a near-infrared spectroscopy study" LINK

"Fourier transform infrared spectroscopic analysis of organic archaeological materials: background paper" LINK

"Near infrared technique as a tool for the rapid assessment of waste wood quality for energy applications" LINK

"Research Note: Nondestructive detection of super grade chick embryos or hatchlings using near-infrared spectroscopy" LINK

"Fraud Detection in Batches of Sweet Almonds by Portable Near-Infrared Spectral Devices" LINK

"Contaminant detection in pistachio nuts by different classification methods applied to short-wave infrared hyperspectral images" LINK

"Prediction of fatty acid and mineral composition of lentils using near infrared spectroscopy" LINK

"Intact Macadamia Nut Quality Assessment Using Near-Infrared Spectroscopy and Multivariate Analysis" LINK

"Identification of Armeniacae Semen Amarum and Persicae Semen from different origins based on near infrared hyperspectral imaging technology" LINK

"Applicability of Raman and Near-infrared Spectroscopy in the Monitoring of freeze-drying injectable ibuprofen" LINK

"Monitoring Breast Reconstruction Flaps Using Near-Infrared Spectroscopy Tissue Oximetry" | LINK

"Prediction of Peking duck intra-muscle fat content by near-infrared spectroscopy" LINK


Hyperspectral Imaging (HSI)

"Combination of spectral and image information from hyperspectral imaging for the prediction and visualization of the total volatile basic nitrogen content in cooked ..." | LINK

"A Spectrum Extension Approach for Radiometric Calibration of the Advanced Hyperspectral Imager Aboard the Gaofen-5 Satellite" LINK

"Affinity between Bitumen and Aggregate in Hot Mix Asphalt by Hyperspectral Imaging and Digital Picture Analysis" "Coatings LINK


Chemometrics and Machine Learning

"Remote Sensing : Sentinel-1 and 2 Time-Series for Vegetation Mapping Using Random Forest Classification: A Case Study of Northern Croatia" LINK

"Calibration Maintenance Application of Near-infrared Spectrometric Model in Food Analysis" LINK

"Fast quantification of total volatile basic nitrogen (TVB-N) content in beef and pork by near-infrared spectroscopy: Comparison of SVR and PLS model" LINK

"Nutritive quality prediction of peaches during storage" LINK


Research on Spectroscopy

"Efficient Maize Tassel-Detection Method using UAV based Remote Sensing" LINK

"A Mini Review on Characteristics and Analytical Methods of Otilonium Bromide" LINK

"Design of an Innovative Methodology for Cerebrospinal Fluid Analysis: Preliminary Results" Sensors LINK

"Effect of Na doping on microstructures, optical and electrical properties of ZnO thin films grown by sol-gel method" LINK


Process Control and NIR Sensors

"Conjugated Organic Photothermal Films for Spatiotemporal Thermal Engineering" LINK

"Extended neuromonitoring in aortic arch surgery" | LINK


Agriculture NIR-Spectroscopy Usage

"Fostering soil sustainability and food safety in urban agricultural areas of Naples, Italy" LINK

"The Application of Near Infrared Reflectance Spectroscopy in Nutrient Ingredient Determination of Silage Maize" LINK

"Identification of soybean varieties based on hyperspectral imaging technology and onedimensional convolutional neural network" LINK

"Minerals, Vol. 11, Pages 576: Flow Properties Analysis and Identification of a Fly Ash-Waste Rock Mixed Backfilling Slurry" LINK

"Applied Sciences, Vol. 11, Pages 5023: Drying Stress and Strain of Wood: A Review" LINK

"Spectral analysis of total phosphorus in soils based on its diagnostic reflectance spectra" LINK


Horticulture NIR-Spectroscopy Applications

"Concurrent starch accumulation in stump and high fruit production in coffee (Coffea arabica)" LINK


Food & Feed Industry NIR Usage

"Foods : Potential Contribution of Climate Change to the Protein Haze of White Wines from the French Southwest Region" LINK

" Foods : Is the Consumer Ready for Innovative Fruit Wines? Perception and Acceptability of Young Consumers" LINK


Pharma Industry NIR Usage

"[ZITATION][C] Bilateral acute macular neuroretinopathy following COVID‐19 infection" LINK


Medicinal Spectroscopy

"Utility of Ultrasonographic Assessment of Distal Femoral Arterial Flow during Minimally Invasive Valve Surgery" LINK

"Revealing Inflammatory Indications Induced by Titanium Al-loy Wear Debris in Periprosthetic Tissue by Label-Free Correla-tive High-Resolution Ion, Electron ..." LINK


Laboratory and NIR-Spectroscopy

"Use of non-destructive instrumental techniques to evaluate effects of gamma irradiation, quality and sensory attributes in orange juice" LINK


Other

"Crossing the threshold: new insights on exercise thresholds and acute recovery from high-intensity exercise" LINK

"The polymeric glyco-linker controls the signal outputs for plasmonic gold nanorod biosensors due to biocorona formation" LINK

"近红外光谱传感物联网研究与应用进展" LINK

"Charge Transport in and Electroluminescence from sp<sup>3</sup>-Functionalized Carbon Nanotube Networks" LINK

"Unprecedented Thermal Stability of Plasmonic Titanium Nitride Films up to 1400 °C" LINK

"CopperBased Plasmonic Catalysis: Recent Advances and Future Perspectives" LINK


.
NIR-Predictor – Manual


NIR-Predictor – Manual

Predicting Spectra

It’s easy to use with NIR-Predictor,
just drag & drop your data for getting the prediction results.

It supports an automatic file format detection.
So you don’t need to specify the instrument type and settings! See the list of supported formats and NIR Vendors: NIR-Predictor supported Spectral Data File Formats

Use the included data to checkout how it feels:

  1. Open the demo Spectra folder by using the Menu > Open Demo Spectra or press F8.
    There are files with spectra from different Vendors.
  2. Drag & drop a spectra file onto the NIR-Predictor window (or press Ctrl+O as for ’Open some files).
  3. The spectra will be
    • loaded
    • pre-processed
    • predicted and
    • reported

Note:
All the steps are fully automatic.
All calibrations that are compatible with the spectra, will produce prediction results in one go.
To select specific calibrations choose the Application. Where the ” ” empty means use all the calibrations.
To define a Application read more in chapter “Applications”

Hint:
To get access to Statistics of Predictions and Reports use the Menu > Show more/less (Ctrl+M) or you can simply resize the window. Here you can also re-do the Analyze step manually with changed inputs (e.g. Result Ordering).


Creating your own Calibrations

How it works – step by step

  1. You have measured your samples with you NIR-Instrument Software.
    And got the Lab-values of these samples.

    samples
    -> measured NIR-spectra
    -> Lab-references analytics

  2. Now you need to combine these data.

    NIR-spectra + Lab-references
    -> PropertiesBySamples

    Note: If you combined these data already in your NIR software used,
    and you can export it as a JCAMP-DX file then use
    Menu > Create Request File .req ... (F2)
    and read the “Help.html” and NIR-Predictor JCAMP.
    Else proceed as below.

    The NIR-Predictor provides tooling for that:

    Menu > Create Properties File... (F6)

    Select the folder with your NIR spectra measured for an application.
    NIR-Predictor creates a customized Properties file template for that data to enter the Lab values.

    Note: You don’t need to specify your instrument or vendor or an application. It’s all done automatically. And also the sample spectra are detected and grouped automatically!

  3. Use your favorite editor or spreadsheet program to enter and copy&paste
    the Lab-references Values into the columns “Prop1”, “Prop2” etc. and save the file.
  4. A final check of your entered data is done by NIR-Predictor,
    to make sure your data ist complete and all is fine.

    Menu > Create Calibration Request... (F7)

    Select the folder with the filled file.
    A CalibrationRequest.zip is created with the necessary data
    if enougth diverse Lab values are entered.

  5. Email the CalibrationRequest.zip file
    to info@CalibrationModel.com to develop the calibrations.
  6. When your calibrations are ready, you will receive an email with a link
    to the CalibrationModel WebShop where
    you can purchase and download the calibration files,
    that work with our free NIR-Predictor software without internet access.

    Note: Your sent NIR data is deleted after processing.
    We do not collect your NIR data!

Note: Further details can be found under “Create Properties File” and “Create Calibration Request”.


Configure the Calibrations for prediction usage

Configuration:

  1. in NIR-Predictor : Menu > Open Calibrations (F9)
  2. an explorer window is opened where the calibrations are located
  3. create a folder for your application, choose a name
  4. copy the calibration file(s) (*.cm) into that folder
  5. in NIR-Predictor : Menu > Search and load Applications (F4)

Usage:

  1. in NIR-Predictor : open the Application drop down list, and select your application by name
  2. if all is fine, the calibration file is valid and not expired, it shows : Calibration “1 valid calibation”
  3. the NIR-Predictor is now ready to predict
  4. to switch the application, goto 6.

Applications

The Application concept allows to group multiple Calibrations together for an Application. By selecting an Application before prediction, only the Calibrations belonging to the Application will be used for Prediction. In the Demo Data this is used to have multiple spectrometer as Application. This can be used easily as e.g. as Application “Meat Products” containing Fat and Moisture Calibration.

To create an Application, create a folder with the Application’s name inside the Calibrations folder, and move/copy all the Calibrations files to this Application folder. To remove a Calibration from the Application, remove the Calibration file from the Application folder.

After creating an new Application folder, press menu Search and load Applications (F4) to update the NIR-Predictor dialog where the Application can be selected via the dropdown list. You don’t need to close the NIR-Predictor.

After moving Calibration files around, press menu Search and load Calibrations (F5) to update the NIR-Predictor dialog.

The use-all case

In the NIR-Predictor dialog where the Application can be selected via the dropdown list, the empty "" name means that all (yes all) valid Calibrations will be used for prediction.

Note: The Prediction Report will contain only results from spectral compatible Calibrations with the given spectra. That allows to automatically handle the multi vendor NIR instrument usage.


Prediction Result Report

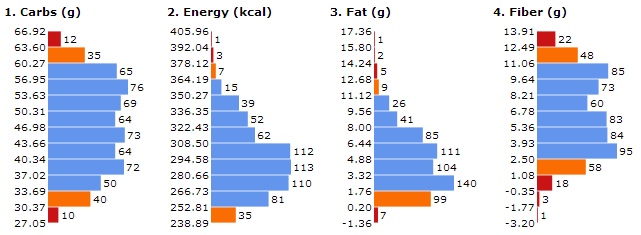
Histograms of Prediction Values per Property

Shows the distribution of the predicted results per calibration. The histogram range contains the range of the calibrated property and includes the predicted results.

The histogram bar (bin) color is defined as follow:

  • blue : all predictions inside calibration range.
  • red : all predictions outside calibration range.
  • orange : some overlaps with calibration range.
    So not all spectra in a orange bin are outside calibration range.
Histograms

Note: Predicted values are always shown in Histogram table and Prediction Value List table, even if the spectrum does not fit into model (spectrum different to model, aka Residual Outlier) shown as Out = X.

Note: Old browsers like Microsoft Internet Explorer 11 don’t support the grafics for Histogram charts. Use an current browser like Firefox or Chrome or Edge.

Note: If your browser opens the report too slow, try to deactivate some browser plugins, because they can filter what you look at and some add-ons are really slow.

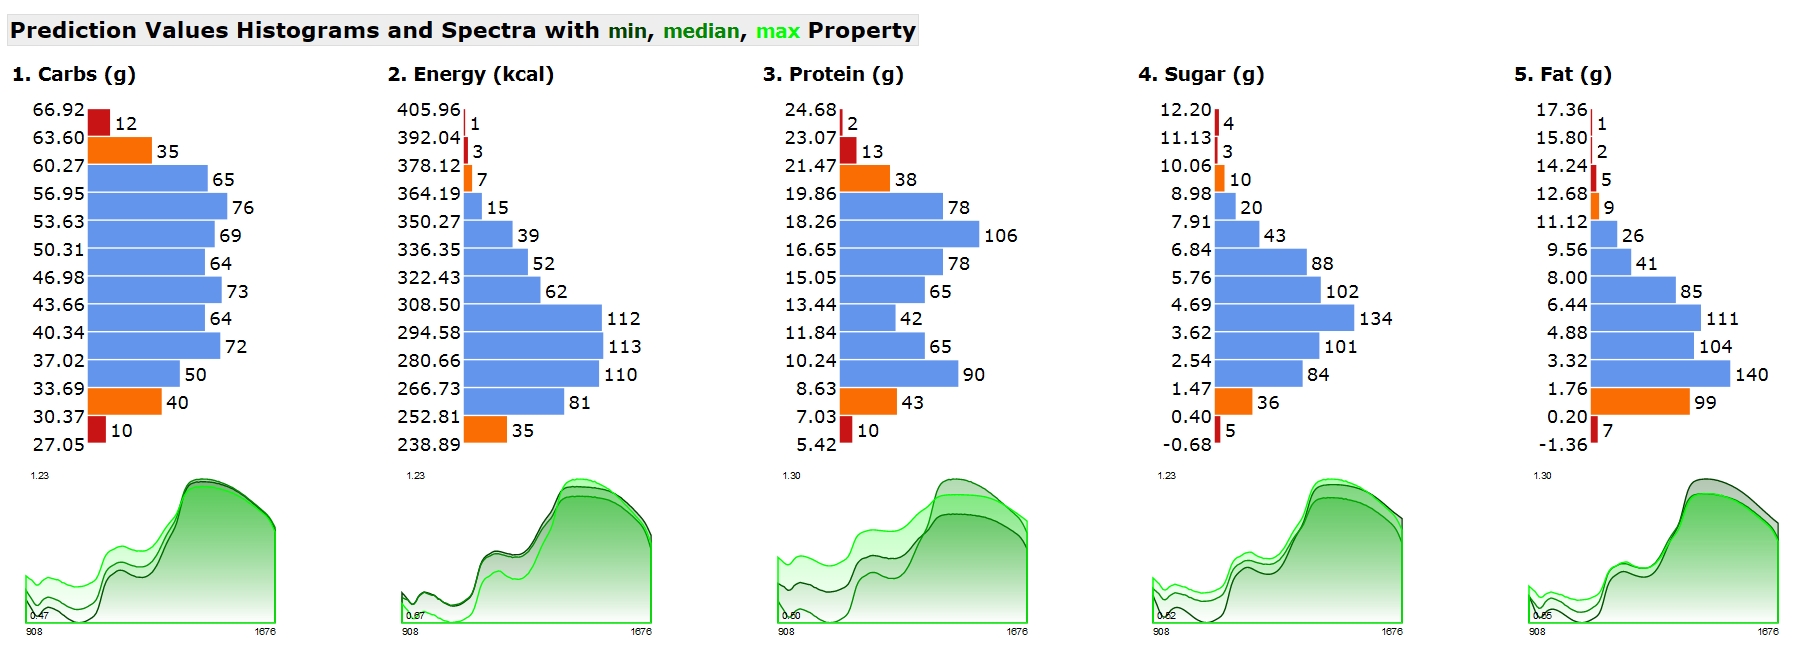
Spectra Plot Thumbnail on the Prediction Report

Visualizes the min,median,max spectrum of the spectra dropped as files on the NIR-Predictor. This gives a minimal and good spectral overview of the predicted property results.

  • Spectra Plot color legend: min,median,max spectrum by predicted property or if no calibration is available by spectral intensity.
  • The min,median,max is determined from the predicted properties or if not available from the intensity of the spectra.
  • Beside the histogram of the predicted properties, where the distribution can be seen, the spectra shown are the ones from min,median,max predicted property.
  • This gives a minimal and good spectral overview of the predicted property results.
  • The “Spectral Range” and number of datapoints is shown in the Prediction Report Header below the listed spectra files.
  • To zoom the spectra plot a little, zoom the report in the browser (hold ctrl + mouse wheel, or pinch on touch screen).
  • The spectra plots and histograms are stored with the report and can be archived.

Note

  • Note that the spectra are shown in the raw values that are loaded, they are not shown pre-processed as the calibration model uses them to make the prediction.
  • Note that the median property spectrum is the median from the predicted property pobulation and not the “median” of the calibration property range.
  • Note that in the multi calibration prediction case, the spectra are selected for each property based on the related predicted property values and so the spectra plots shows typical different spectra.
Spectra Plot

Outlier Detection

To safeguard the prediction results, outliers are automatically checked for each individual prediction. This is based on limits that are determined when creating the calibration with the base data. Thus, a strange spectral measurement can be detected and signaled as an outlier even without base data only by means of the calibration and the NIR predictor. A prediction result with outlier warning is to be distrusted. How the various outlier tests are interpreted and how to avoid them in practice is described here.

The spectrum is an outlier to the model, if the spectrum is not similar with the spectra and lab-values the model is built with.

This legend is shown on each NIR-Predictor prediction report below the results:

Outlier (Out) Symbol Description

  • “X” : spectrum does not fit into model (spectrum different to model)
  • “O” : spectrum is wide outside model center (spectrum similar to model but far away)
  • “=” : prediction is outside upper or lower range of model (property outside model range)
  • “-” : spectrum is incompatible to calibration

Note: A prediction result with outlier warning is to be distrusted.

There are 3 outlier cases (X, O, =) and the incompatible data case “-”.

  • The bad case is “X”
  • the medium case is “O”
  • and the soft case is “=”.

The technical names in literature correspond to:

  • “X” : Spectral Residual Outlier
  • “O” : Leverage Outlier
  • “=” : Property Range Outlier

These 3 outlier cases can appear in combinations, like “XO=” or “XO” or “O=” or “X=”. The more outlier marker are shown the more likely the spectrum is an Outlier.

The default setting in NIR-Predictor Menu > “Report with Simplified Outlier Symbols”

  • is ON, that will show only the worst case instead of all combinations to have a simplified minimal information.
  • if OFF, that will show the combinations (e.g. “XO=” or “XO” or “O=” or “X=”), which is more informative for analyzing problem cases.

Some hints to avoid these Outliers:

  • “X” : spectrum does not fit into model (spectrum different to model)
    Check if the spectrum is noise only, or has no proper signal. That can happen when measured past the sample or measured into the air or at a different substance. If you have multiple NIR instruments of the same type, use spectra measured with different instruments for the calibration.
  • “O” : spectrum is wide outside model center (spectrum similar to model but far away) Sample temperature has an effect on NIR spectra shape, use spectra measured at different (typical use) temperatures (sample temperature, instrument temperature).
  • “=” : prediction is outside upper or lower range of model (property outside model range)
    Use more spectra for the calibration in the Lab value region where your special interest is. If the predicted value is only a little bit out of the calibration range, it can be Ok. Add these spectra to the calibration spectra (with the Lab values), to extend the prediction range of the calibration.
  • “-” : spectrum is incompatible to calibration
    The spectra (from the NIR instrument) has a different wavelength range or a different resolution than the spectra used for calibration. Check Instrument settings (wavelength range, resolution)

Result Ordering

To change the ordering, a drop-down-box is located below the Analyze button. If there is an analysis from the current session, and the Result Ordering is changed, the data is re-Analyzed and reported with the new Result Ordering setting. That allows to compare the different orderings. The Result Ordering is listed in the Prediction Report above the Prediction Value List and stored in the settings.

The order/sorting of the prediction results of the spectra can be defined:

  • GivenOrder (default) the given order of the spectra from file select dialog or drag&drop

*) sorted : ascending sort

  • Date_Name sorted by Date (if any) and then by Name
  • Name_Date sorted by Name and then by Date
  • Date_NamesWithNumbers sorted by Date (if any) and then by Name with number logic
  • NamesWithNumbers_Date sorted by Name with number logic (e.g. “ABC1” is before “ABC002” ) and then by Date

*) as above but sorted Rev : reverse sort = descending sort

  • Rev_Date_Name
  • Rev_Name_Date
  • Rev_Date_NamesWithNumbers
  • Rev_NamesWithNumbers_Date

E.g. with reverse sort by Rev_Date_Name, the newest spectra appear on top.

Depending on how many calibrations are used the result table is getting broader. To print the report (e.g. to Adobe PDF, FreePDF or Microsoft XPS), sometimes the landscape format is shorter in number of pages or in portrait a scale of 80% fits nicely. Or try another internet browser (Mozilla Firefox, Google Chrome, Microsoft Edge, …) to print the report and set the browser as your default browser so it will be opened by default.

Archiving Reports

Each report is contained in one file only, including the grafics. To save storage space the report file folder can be compressed to a zip file (.zip, .7z).


Enter lab values to NIR spectra

Entering the laboratory reference values for NIR calibrations

We have developed specialized tools into NIR-Predictor to combine the NIR and Lab data is a sample-based safe manner.

The main target is to improve Data Quality during the step of combining of the Lab data and the NIR data, because to model a good reliable calibration the data that build the base needs to be of high quality.

It also simplifies to enter the lab values manually to the corresponding NIR data, because of automatically grouping repeated NIR measurements of the same sample, so the lab values can be entered sample based and not by spectrum.

It helps to avoid false reference data, because of the broken relation of NIR spectra and reference values, data entry on the wrong position in the table.

And Helps to detect errors of duplicated or multiple copies of spectra files, and checks for inconsistencies in Date-Time and Sample-Naming. It also checks for missing values.

That all increases the Data Quality for the next step of Calibration Development, and makes data entry a less time consuming and less risky work.

How it works

  1. Menu > Create Properties File... (F6) select the folder with your NIR spectra measured for an application. NIR-Predictor creates a Properties file template for that data : PropertiesBySamples.csv.txt
  2. Use your favorite editor or spreadsheet program to enter and copy&paste the Lab Values into the columns and save the file.
  3. Menu > Create Calibration Request... (F7) select the folder with the filled file for a last check and a Calibration Request file is created with the needed data as a single zip file.
  4. Email the Calibration Request file to info@CalibrationModel.com to develop the calibrations.

Ok that is it, the NIR-Predictor guides you through the steps needed. And if you need to know more details, the Chapter “Create Properties File” is for you.

Create Properties File

Note:

  • If you have (exported) JCAMP-DX files containing the Lab-Values, you don’t need to do this step.
    You can send the JCAMP file with your Request (.req) file directly to the calibration service at info@CalibrationModel.com.
  • If your JCAMP-DX files does NOT contain Lab-Values, this is a way to go.

For calibrating the spectra to the lab-values you need to assign the lab-values to the spectra. The easiest way is to have a table where each spectrum (row) is linked to multiple lab-values (columns). This function Create Properties File build such a table for the selected spectra folder automatically!

This table is stored in the file PropertiesBySamples.csv.txt. This can be created for any spectra folder you like. The file extension is .csv.txt to make it easy to edit in a text editor and also in a spreadsheet (excel). The columns are standard TAB separated.

The file header line contains :

Sample Replicates Names Prop1 Prop2 Prop3 DateFirst DateLast Hashes

Where Name and Date describes the spectrum.

Prop1, Prop2, Prop3 are the place to enter the Lab Reference Concentrations properties corresponding to each spectrum. It can be extended to Prop4, Prop5, … etc. Of course you can enter real word names like “Fat (%)” instead of “Prop1”. It’s recommended to put the measurement unit beside the name.

Replicates is the number of replicated or repeated spectra of a sample that is grouped together in the Sample based property file. Sample name and the DateFirst / DateLast between the sample spectra are measured.

Date format is ISO-8601. Missing Dates are 0002-02-02T00:00:00.0000000.

If the file PropertiesBySamples.csv.txt already exist in the selected folder, the user will be notified (it will not be overwritten, because the file may contain user entered Lab-values). The Lab Reference Concentrations values are initialized to 0 (zero) and needed to be changed.

Note: 0 is not interpreted as missing value! If you have a 0 concentration value, put in 0 or 0.0 .

The entry of properties is as easy as possible, because it’s organized by Sample (and not by Spectra), so it’s like your Lab-Value Table that is sample based. The sample rows are sorted in a special way by Sample name. Sorting by Date or alphabetically by Sample can done easily in a spreadsheet program.

Note: when coping lab values to the samples make sure they correspond, so that there are no gaps and the sorting is the same.

The Spectra (rows) are initially sorted by name (and date) to have the replicates/repeats together. You can sort for your convenience in a spreadsheet program.

Enter the Lab Reference Concentrations to the spectra/sample.

Enter the Lab-Values in spreadsheet (e.g. Excel) or a text editor (e.g. Notepad++). If done, use the next menu Create Calibration Request.

Hints: Data handling:

  • The NIR-Predictor creates the PropertiesBySamples.csv.txt once, after that the user is responsible for its content. That means NIR-Predictor does not change this file anymore.
  • You can remove entire rows (spectra) in the property file. You don’t need to remove the spectra files. The NIR-Predictor is aware of the relation, the PropertiesBySamples.csv.txt defines what will be calibrated.
  • How to add more spectra files?

    The additional spectra can be handled in a separate folder, create the property file and copy the spectra to the other folder and copy/merge the property files together in your editor or spreadsheet.

    Or

    Copy the spectra into the folder, rename the PropertiesBySamples.csv.txt to e.g. “PropertiesBySamples-Part1.csv.txt” and use Create Properties File to create a new PropertiesBySamples.csv.txt with all the spectra. You can copy/merge the content of the Properties files together in your editor or spreadsheet.

  • What happens with possible duplicate rows? It does no harm to the Calibration because we do an exact checking and data cleaning in the calibration process.
  • What happens to duplicate spectra names? The spectra names are not relevant for the calibration process. The spectra names are helpful to assign the lab-values to the corresponding spectrum entry. That’s why the table is initially sorted by name. The spectra names can be edited by the user.

Create Calibration Request

The menu function Create Calibration Request packs a created Properties file (see “Create Properties File”) and it’s linked spectra files in a compressed ZIP file for sending to the CalibrationModel.com Service.

Please note that the number of measured quantitative samples need to be at least 60 . That means you need at least 60 different spectra (not counting the replicate/repeated measurements).

It shows additional property information about the data you have entered, like – the property type (Quantitative) – it’s range (min – max) and – the number of unique values and – if the Lab-values are enough diverse to get calibrated.

First select the folder with the PropertiesBySamples.csv.txt and measured spectra files of samples you have Lab-values. The data is checked and you get notified what is missing or might be wrong. If something needs to be changed, edit the PropertiesBySamples.csv.txt and do Create Calibration Request again. Your last selected folder is remembered, so you can press return in the folder selection dialog.

Hint: The keyboard shortcuts for redoing it after you edited some entries is : F7 Return – that allows you to get the property information quickly.

Hint: If you open the PropertiesBySamples.csv.txt in a spreadsheet program, you can create Histogram plots of the entered Lab-values, to see in which range are to less samples measurements.

When all is fine

When all is fine the “CalibrationRequest.zip” file is created for that data.

The ZIP file contains:

  • your PropertiesBySamples.csv.txt
  • your personal REQuest file for your computer system, that looks like
    e.g. “337dcdc06b2d6dfb0b5c4bba578642312edf2ae84d909281624d7e26283e8b07 WIN-GB0PB48GSK4.req”
  • the spectra data files

Note: If the CalibrationRequest.zip file is already created and you change the PropertiesBySamples.csv.txt make sure to delete the old CalibrationRequest.zip file first! In the dialog it states if it was successfully created or NOT because it already exist. So you are always on the safe side.

Note: CalibrationRequest.zip file name contains the property names to know what would be calibrated and at the end an identification number for referencing the file. E.g. “CalibrationRequest ‘Prop1’ – ‘Prop2’ h31T3wOH.zip”


Program Settings

  • The users program settings are stored in UserSettings.json
  • The program counters are stored in GlobalCounters.json

Further References

NIR-Predictor Download

The free NIR-Predictor software
  • comes with demo data, so you can predict sample spectra with demo calibrations.
  • has no functional limitations, no nagging, no ads and needs no license-key.
  • you need no account and no registration to download and use.
  • runs on Microsoft Windows 10/8/7 (Starter, Basic, Professional) (32 bit / 64 bit).
  • no data is ever transmitted from your local machine. We don't even collect usage data.
See more Videos Beside the free NIR-Predictor software with Windows user interface, the real-time Predictor Engine is also available
  • for embedded integration in application, cloud and instrument-software (ICT).
  • As a light-weigt single library file (DLL) with application programming interface (API), documentation and software development kit (SDK) including sample source code (C#).
  • Easy integration and deployment, no software license protection (no serial key, no dongle).
  • Put your spectrum as an array into the multivariate predictor, no specific file format needed.
  • Fast prediction speed and low latency because of compiled code library (direct call, no cloud API).
  • Protected prediction results with outlier detection information.
See NIR Method Development Service for Labs and NIR-Vendors (OEM, White-Label)
Software Size Date Comment
NIR-Predictor V2.6.0.2 (download) What's new, see Release Notes By downloading and/or using the software you accept the Software License Agreement (EULA) 3.7 MB 18.08.2021 public release
Minimal System Requirements Windows 7 Starter 32Bit, 1.6 GHz, 2 GB RAM, non-Administrator account Installation There are no administrator rights required, unpack the zip file to a folder "NIR-Predictor" in your documents or on your desktop. Read the ReadMe.txt and double click the NIR-Predictor.exe file. Upgrade If you have installed an older version of NIR-Predictor then unpack into a different folder named e.g. "NIR-PredictorVx.y". All versions can run side-by-side. Copy the Calibrations in use to the new version into the "Calibration" folder. That's all. Uninstall Make sure to backup your reports and calibrations inside your "NIR-Predictor" folder. Delete the "NIR-Predictor" folder. Start Calibrate See also:

The free NIR-Predictor software
  • comes with demo data, so you can predict sample spectra with demo calibrations.
  • has no functional limitations, no nagging, no ads and needs no license-key.
  • you need no account and no registration to download and use.
  • runs on Microsoft Windows 10/8/7 (Starter, Basic, Professional) (32 bit / 64 bit).
  • no data is ever transmitted from your local machine. We don't even collect usage data.
See more Videos Neben der kostenlosen NIR-Predictor-Software mit Windows-Benutzeroberfläche ist die Echtzeit-Predictor-Engine auch verfügbar
  • für die eingebettete Integration in Applikations-, Cloud- und Geräte-Software (ICT).
  • Als leichtgewichtige Einzelbibliotheksdatei (DLL) mit Anwendungsprogrammier-Schnittstelle (API), Dokumentation und Software Development Kit (SDK) inklusive Beispiel-Quellcode (C#).
  • Einfache Integration und Bereitstellung, kein Software-Lizenzschutz (kein Serienschlüssel, kein Dongle).
  • Geben Sie Ihr Spektrum als Array in den multivariaten Prädiktor ein, es ist kein spezielles Dateiformat erforderlich.
  • Schnelle Vorhersagegeschwindigkeit und niedrige Latenz aufgrund der kompilierten Code-Bibliothek (direkter Aufruf, keine Cloud-API).
  • Geschützte Vorhersageergebnisse mit Informationen zur Ausreißererkennung.
Siehe NIR-Methodenentwicklungsservice für Labore und NIR-Anbieter (OEM, White-Label)
Software Size Date Comment
NIR-Predictor V2.6.0.2 (download) What's new, see Release Notes By downloading and/or using the software you accept the Software License Agreement (EULA) 3.7 MB 18.08.2021 public release
Minimal System Requirements Windows 7 Starter 32Bit, 1.6 GHz, 2 GB RAM, non-Administrator account Installation There are no administrator rights required, unpack the zip file to a folder "NIR-Predictor" in your documents or on your desktop. Read the ReadMe.txt and double click the NIR-Predictor.exe file. Upgrade If you have installed an older version of NIR-Predictor then unpack into a different folder named e.g. "NIR-PredictorVx.y". All versions can run side-by-side. Copy the Calibrations in use to the new version into the "Calibration" folder. That's all. Uninstall Make sure to backup your reports and calibrations inside your "NIR-Predictor" folder. Delete the "NIR-Predictor" folder. Start Calibrate See also:

The free NIR-Predictor software
  • comes with demo data, so you can predict sample spectra with demo calibrations.
  • has no functional limitations, no nagging, no ads and needs no license-key.
  • you need no account and no registration to download and use.
  • runs on Microsoft Windows 10/8/7 (Starter, Basic, Professional) (32 bit / 64 bit).
  • no data is ever transmitted from your local machine. We don't even collect usage data.
See more Videos Oltre al software gratuito NIR-Predictor con interfaccia utente Windows, il Predictor Engine in tempo reale è disponibile anche
  • per l'integrazione embedded in applicazioni, cloud e strumenti-software (ICT).
  • Come un singolo file di libreria leggera (DLL) con interfaccia di programmazione dell'applicazione (API), documentazione e kit di sviluppo del software (SDK) incluso il codice sorgente di esempio (C#).
  • Facile integrazione e distribuzione, nessuna protezione della licenza software (nessuna chiave seriale, nessun dongle).
  • Inserisci il tuo spettro come array nel predittore multivariato, non è necessario alcun formato di file specifico.
  • Velocità di predizione veloce e bassa latenza grazie alla libreria di codice compilata (chiamata diretta, nessuna API cloud).
  • Risultati di predizione protetti con informazioni di rilevamento degli outlier.
Vedi Servizio di sviluppo del metodo NIR per laboratori e fornitori NIR (OEM, White-Label)
Software Size Date Comment
NIR-Predictor V2.6.0.2 (download) What's new, see Release Notes By downloading and/or using the software you accept the Software License Agreement (EULA) 3.7 MB 18.08.2021 public release
Minimal System Requirements Windows 7 Starter 32Bit, 1.6 GHz, 2 GB RAM, non-Administrator account Installation There are no administrator rights required, unpack the zip file to a folder "NIR-Predictor" in your documents or on your desktop. Read the ReadMe.txt and double click the NIR-Predictor.exe file. Upgrade If you have installed an older version of NIR-Predictor then unpack into a different folder named e.g. "NIR-PredictorVx.y". All versions can run side-by-side. Copy the Calibrations in use to the new version into the "Calibration" folder. That's all. Uninstall Make sure to backup your reports and calibrations inside your "NIR-Predictor" folder. Delete the "NIR-Predictor" folder. Start Calibrate See also: