Spectroscopy and Chemometrics/Machine-Learning News Weekly #16, 2023

Get the Spectroscopy and Chemometrics News Weekly in real time on Twitter @ CalibModel and follow us.

NIR Calibration-Model Services

Spectroscopy and Chemometrics News Weekly 15, 2023 | NIRS NIR Spectroscopy MachineLearning Spectrometer Spectrometric Analytical Chemistry Chemical Analysis Lab Labs Laboratories Laboratory Software IoT Sensors QA QC Testing Quality LINK

Spektroskopie und Chemometrie Neuigkeiten Wöchentlich 15, 2023 | NIRS NIR Spektroskopie MachineLearning Spektrometer IoT Sensor Nahinfrarot Chemie Analytik Analysengeräte Analysentechnik Analysemethode Nahinfrarotspektroskopie Laboranalyse LINK

Spettroscopia e Chemiometria Weekly News 15, 2023 | NIRS NIR Spettroscopia MachineLearning analisi chimica Spettrale Spettrometro Chem IoT Sensore Attrezzatura analitica Laboratorio analisi prova qualità Analysesystem QualityControl LINK

Near-Infrared Spectroscopy (NIRS)

“Prediction of sensory attributes in winemaking grapes by on-line near-infrared spectroscopy based on selected volatile aroma compounds” | LINK

“Monitoring chlorophyll changes during Tencha processing using portable near-infrared spectroscopy” LINK

“Multivariate regression methods for estimating basic density in Eucalyptus wood from near infrared spectroscopic data” LINK

“Nirs tools for prediction of main extractives compounds of teak (Tectona grandis L.) heartwood” LINK

“Biosensors : Online Inspection of Browning in Yali Pears Using Visible-Near Infrared Spectroscopy and Interpretable Spectrogram-Based CNN Modeling” | LINK

“Applied Sciences : Rapid Detection of Tea Polyphenols in Fresh Tea Leaves Based on Fusion of Visible/Short-Wave and Long-Wave near Infrared Spectroscopy and Its Device Development” LINK

“Wildfire-Grazing Impact on Forage Quality Assessed with Near-Infrared Spectroscopy and Generalized Partial Least Squares Regression” | LINK

“Rapid classification of peanut varieties for their processing into peanut butters based on near-infrared spectroscopy combined with machine learning” LINK

“Detection of Low-Level Adulteration of Hungarian Honey Using near Infrared Spectroscopy” | LINK

“Quantitative analysis of starch species based on near-infrared spectroscopy and quaternion convolution neural network” LINK

“Near Infrared Spectroscopy (NIRS): Fast and Non-destructive Metohd to Determination of Chemical Compositions of Modified Cassava Flour (Mocaf)” LINK

“Near-Infrared Reflectance Spectroscopy for Quantitative Analysis of Fat and Fatty Acid Content in Living Tenebrio molitor Larvae to Detect the Influence of …” | LINK

Infrared Spectroscopy (IR) and Near-Infrared Spectroscopy (NIR)

“NearInfraredResponsive Hydrocarbons Designed by Extension of Indeno[1,2,3,4pgra]perylene at the 1,2,12Positions” LINK

Chemometrics and Machine Learning

“Comparison Among Pre-Processing Approaches to the Prediction Performance of Near Infrared Spectroscopic Models” LINK

“Accurate Classification of Chunmee Tea Grade Using NIR Spectroscopy and Fuzzy Maximum Uncertainty Linear Discriminant Analysis” | LINK

“Spectral imaging and chemometrics applied at phenotyping in seed science studies: a systematic review” LINK

Facts

“Deepfakes are everywhere – should we be worried?” | Deepfakes AI AIphoto aivideo AILiveVideo AIRealtimeVideo TED TEDTalks LINK

Research on Spectroscopy

“LightResponsive Programmable ShapeMemory Soft Actuator Based on Liquid Crystalline Polymer/Polyurethane Network” LINK

Equipment for Spectroscopy

“The Authentication of Aceh Rice Variety Sigupai Using Portable Near-Infrared Reflectance Spectrometer” LINK

“A Stacking-Based Ensemble Learning Method for Available Nitrogen Soil Prediction with a Handheld Micronear-Infrared Spectrometer” | LINK

Environment NIR-Spectroscopy Application

“A Biomimetic Lubricating Nanosystem with Responsive Drug Release for Osteoarthritis Synergistic Therapy” LINK

“Remote Sensing : Assessing the Potential of 10-m Resolution TVDI Based on Downscaled LST to Monitor Soil Moisture in Tang River Basin, China” LINK

Agriculture NIR-Spectroscopy Usage

“Damage simulation experiment of aircraft skin coating based on hyperspectrum” LINK

“The effect of upland crop planting on field N2O emission from rice-growing seasons: A case study comparing rice-wheat and rice-rapeseed rotations” LINK

Food & Feed Industry NIR Usage

“Sensors : Prediction of Mineral Composition in Wheat Flours Fortified with Lentil Flour Using NIR Technology” | LINK

Medicinal Spectroscopy

“Neanderthal subsistence, taphonomy and chronology at Salzgitter‐Lebenstedt (Germany): a multifaceted analysis of morphologically unidentifiable bone” LINK

“Biomedicines : A Lymph Node Ratio Model for Prognosis of Patients with Pancreatic Neuroendocrine Tumors” | LINK

Other

“Variations in the morphological and chemical composition of the rhizomes of Polygonatum species based on a common garden experiment” LINK

“Multiple Function Synchronous Optimization by PbS Quantum Dots for Highly Stable Planar Perovskite Solar Cells with Efficiency Exceeding 23%” LINK

“Full-field optical spectroscopy at a high spectral resolution using atomic vapors” LINK

“Non-Destructive Study of Egyptian Emeralds Preserved in the Collection of the Museum of the Ecole des Mines. Minerals 2023, 13, 158” LINK

.

Spectroscopy and Chemometrics/Machine-Learning News Weekly #48, 2022

This week’s NIR news Weekly is sponsored by Your-Company-Name-Here – NIR-spectrometers. Check out their product page … link

Get the Spectroscopy and Chemometrics News Weekly in real time on Twitter @ CalibModel and follow us.

NIR Calibration-Model Services

Spectroscopy and Chemometrics News Weekly 47, 2022 | NIRS NIR Spectroscopy MachineLearning Spectrometer Spectrometric Analytical Chemistry Chemical Analysis Lab Labs Laboratories Laboratory Software IoT Sensors QA QC Testing Quality LINK

Spektroskopie und Chemometrie Neuigkeiten Wöchentlich 47, 2022 | NIRS NIR Spektroskopie MachineLearning Spektrometer IoT Sensor Nahinfrarot Chemie Analytik Analysengeräte Analysentechnik Analysemethode Nahinfrarotspektroskopie Laboranalyse LINK

Spettroscopia e Chemiometria Weekly News 47, 2022 | NIRS NIR Spettroscopia MachineLearning analisi chimica Spettrale Spettrometro Chem IoT Sensore Attrezzatura analitica Laboratorio analisi prova qualità Analysesystem QualityControl LINK

Near-Infrared Spectroscopy (NIRS)

“Deep learning near-infrared quality prediction based on multi-level dynamic feature” LINK

“Rapid measurement of classification levels of primary macronutrients in durian (Durio zibethinus Murray CV. Mon Thong) leaves using FT-NIR spectrometer and …” LINK

“Non-destructive study on identifying and monitoring of Cu-Pb pollution in corn based on near-infrared spectroscopy” | LINK

“PSVI-6 Predicting Fecal Composition Using Near Infrared Spectroscopy (Nirs): Expanding the Calibration to Include Grazing Beef Samples” LINK

“Predictions of multiple food quality parameters using near-infrared spectroscopy with a novel multi-task genetic programming approach” LINK

“… of Polysaccharide Content in Shiitake Culinary-Medicinal Mushroom, Lentinula edodes (Agaricomycetes) via Near-Infrared Spectroscopy Integrated with Deep …” LINK

“Redundancy Analysis to Reduce the High-Dimensional Near-Infrared Spectral Information to Improve the Authentication of Olive Oil” LINK

“Nondestructive evaluation of SW-NIRS and NIR-HSI for predicting the maturity index of intact pineapples” LINK

“Near-Infrared Spectroscopy for Bladder Monitoring: A Machine Learning Approach” | LINK

“Before reliable near infrared spectroscopic analysis-the critical sampling proviso. Part 2: Particular requirements for near infrared spectroscopy” LINK

“Adaptive Artificial Neural Network in near infrared spectroscopy for standard-free calibration transfer” LINK

“NEAR-INFRARED SPECTROSCOPY AS A GREEN TECHNOLOGY TO MONITOR COFFEE ROASTING” | LINK

“Automatic Neural Network Hyperparameter Optimization for Extrapolation: Lessons Learned from Visible and Near-Infrared Spectroscopy of Mango Fruit” LINK

“An approach to detecting diphenylamine content and assessing chemical stability of single-base propellants by near-infrared reflectance spectroscopy” LINK

“Efficiency of near-infrared spectroscopy in classifying Amazonian wood wastes for bioenergy generation” LINK

“Rapid Detection of Cement Raw Meal Composition Based on Near Infrared Spectroscopy” | LINK

“Foods : Discrimination of Minced Mutton Adulteration Based on Sized-Adaptive Online NIRS Information and 2D Conventional Neural Network” LINK

“NIR-based models for estimating selected physical and chemical wood properties from fast-growing plantations” LINK

“Sensors : Domain Adaptation for In-Line Allergen Classification of Agri-Food Powders Using Near-Infrared Spectroscopy” LINK

“Improper sample preparation negatively affects near infrared reflectance spectroscopy (NIRS) nutrient analysis of ground corn” LINK

“Water : Discrimination of Chemical Oxygen Demand Pollution in Surface Water Based on Visible Near-Infrared Spectroscopy” LINK

“Molecules : Detecting Aflatoxin B1 in Peanuts by Fourier Transform Near-Infrared Transmission and Diffuse Reflection Spectroscopy” LINK

“Performance Evaluation of Pre-Processing and Pre-Treatment Algorithm for Near-Infrared Spectroscopy Signals: Case Study pH of Intact Mango “Arumanis”” LINK

“Near infrared spectroscopy for blend uniformity monitoring: An innovative qualitative application based on the coefficient of determination” LINK

“Enhancing Near Infrared II Emission of Gold Nanoclusters via Encapsulation in Small Polymer Nanoparticles” LINK

“Denoising stacked auto-encoder-based near-infrared quality monitoring method by evaluating robust samples” LINK

“A High-efficiency Blue-LED-excitable NIR-II-emitting MgO: Cr3+, Ni2+ Phosphor for Future Broadband Light Source toward Multifunctional NIR Spectroscopy …” LINK

“Investigating if an arm lift procedure is capable of highlighting aging-related differences in microvascular function, using Near-infrared Spectroscopy” LINK

“Use of near-infrared spectroscopy for the classification of medicinal cannabis cultivars and the prediction of their cannabinoid and terpene contents” LINK

“Implication of phenol red in quantification of cultured cancerous cells using near-infrared spectroscopy and aquaphotomics” LINK

“Quantitative analysis of near infrared spectroscopic data based on dual-band transformation and competitive adaptive reweighted sampling” LINK

“Feasibility of near-infrared spectroscopy and chemometrics analysis for discrimination of Cymbopogon nardus from Cymbopogon citratus” LINK

“… of Wet and Dry Mechanochemical Syntheses of Calcium-Deficient Hydroxyapatite Containing Zinc Using X-ray Diffractometry and Near-Infrared Spectroscopy” LINK

Infrared Spectroscopy (IR) and Near-Infrared Spectroscopy (NIR)

“ATRFTIR spectroscopy and chemometric complexity: Unfolding the intraskeleton variability” LINK

“A seleniumsubstituted heptamethine cyanine photosensitizer for nearinfrared photodynamic therapy” LINK

“Identification studies of Escherichia coli using FTIR profiles and strain typing by principal component analysis” LINK

Hyperspectral Imaging (HSI)

“Performance review of a UV/vis/IR fluorescence hyperspectral camera to detect contamination on spacecraft during integration” LINK

“NAPPN Annual Conference Abstract: Hyperspectral imaging for non-destructive determination of cannabinoids in floral and leaf materials of industrial hemp” LINK

” A preliminary investigation into the automatic detection of diseased sheep organs using hyperspectral imaging sensors” LINK

“Recent advances in muscle food safety evaluation: Hyperspectral imaging analyses and applications” LINK

“Fusion of hyperspectral and multispectral images based on principal component analysis and guided bilateral filtering” | LINK

“Performance review of a UV/vis/IR fluorescence hyperspectral camera to detect contamination on spacecraft during integration” | LINK

Spectral Imaging

“Remote Sensing : Evaluation of the Influence of Field Conditions on Aerial Multispectral Images and Vegetation Indices” LINK

Chemometrics and Machine Learning

“Nondestructive determination of grass pea and pea flour adulteration in chickpea flour using nearinfrared reflectance spectroscopy and chemometrics” LINK

“Prediction of the proximate analysis parameters of refuse-derived fuel based on deep learning approach” | LINK

“Evaluation of data pre-processing and regression models for precise estimation of soil organic carbon using Vis-NIR spectroscopy” | LINK

“ResNet models for rapid identification of species and geographical origin of wild boletes from Yunnan, and MaxEnt model for delineation of potential distribution” LINK

“Prediction of winter wheat leaf chlorophyll content based on VIS/NIR spectroscopy using ANN and PLSR” LINK

“Vis-NIR spectroscopy coupled with machine learning algorithms to predict soil gypsum in calcareous soils, southern Iran” LINK

Optics for Spectroscopy

“Architecture of FTO/n-CdS/p-SnSe1-xOx/Au Heterojunction Thin Film Diodes by Thermal Evaporation” | LINK

Equipment for Spectroscopy

“Polymers : Comparative Thermo-Mechanical Properties of Sustainable Epoxy Polymer Networks Derived from Linseed Oil” LINK

Environment NIR-Spectroscopy Application

“Developing spectrotransfer functions (STFs) to predict basic physical and chemical properties of calcareous soils” LINK

Agriculture NIR-Spectroscopy Usage

“Assessment of crop traits retrieved from airborne hyperspectral and thermal remote sensing imagery to predict wheat grain protein content” LINK

“158 Predicting Intake and Digestibility of Nutrients in Beef Cattle fed High Forage Diets Using Near Infrared Spectroscopy (Nirs) of Feces and Internal Markers” LINK

“Wheat leaf disease identification based on deep learning algorithms” | DeepLearning MachineLearning CropDisease Crop LINK

“Early Hemodynamic Response to Single-Pulse Transcranial Magnetic Stimulation Following Previously Inhibited or Excited Motor Cortex” LINK

“Investigation of growth, optical, thermal, mechanical, electrical, laser damage threshold properties of 1, 2, 3-Benzotriazolium Dihydrogen Phosphate (BTDHP) single …” | LINK

Horticulture NIR-Spectroscopy Applications

“Near-Infrared Model and Its Robustness as Affected by Fruit Origin for ‘Dangshan’Pear Soluble Solids Content and pH Measurement” LINK

Food & Feed Industry NIR Usage

“Classification of chocolates by multivariate methods in THz spectroscopy” LINK

Pharma Industry NIR Usage

“Application of fast non-invasive solid state analysis on counterfeit tracing of pharmaceutical drug excipients” LINK

Medicinal Spectroscopy

“Review of Advances in the Measurement of Skin Hydration Based on Sensing of Optical and Electrical Tissue Properties” LINK

.

Spectroscopy and Chemometrics/Machine-Learning News Weekly #14, 2022Spektroskopie und Chemometrie/Machine-Learning News Wöchentlich #14, 2022Spettroscopia e Chemiometria/Machine-Learning Weekly News #14, 2022

NIR Calibration-Model Services

Spectroscopy and Chemometrics News Weekly 13, 2022 | NIRS NIR Spectroscopy MachineLearning Spectrometer Spectrometric Analytical Chemistry Chemical Analysis Lab Labs Laboratories Laboratory Software IoT Sensors QA QC Testing Quality LINK

Spektroskopie und Chemometrie Neuigkeiten Wöchentlich 13, 2022 | NIRS NIR Spektroskopie MachineLearning Spektrometer IoT Sensor Nahinfrarot Chemie Analytik Analysengeräte Analysentechnik Analysemethode Nahinfrarotspektroskopie Laboranalyse LINK

Spettroscopia e Chemiometria Weekly News 13, 2022 | NIRS NIR Spettroscopia MachineLearning analisi chimica Spettrale Spettrometro Chem IoT Sensore Attrezzatura analitica Laboratorio analisi prova qualità Analysesystem QualityControl LINK


Near-Infrared Spectroscopy (NIRS)

"NIR Spectroscopy and Aquaphotomics Approach to Identify Soil Characteristics as a Function of the Sampling Depth" LINK

"Improving the multi-class classification of Alzheimer's disease with machine learning-based techniques: An EEG-fNIRS hybridization study" LINK

"A novel methodology for determining effectiveness of preprocessing methods in reducing undesired spectral variability in near infrared spectra" LINK

"NEAR INFRARED SPECTROSCOPY AS IN-LINE PAT TOOL FOR A ROBUST MOISTURE CONTENT DETERMINATION OF SPIN FREEZE-DRIED SAMPLES" LINK

"Near infrared‐based process analytical technology module for estimating gelatinization optimal point" LINK

"Near Infrared Technology in Agricultural Sustainability: Rapid Prediction of Nitrogen Content from Organic Fertilizer" LINK

"Gasoline octane number prediction from near-infrared spectroscopy with an ANN-based model" LINK

"Rapid On-site Identification of Geographical Origin and Storage Age of Tangerine Peel by Near-infrared Spectroscopy" LINK

"Empirical mode decomposition of near-infrared spectroscopy signals for predicting oil content in palm fruits" LINK

"Miniaturization in NIR Spectroscopy Reshapes Chemical Analysis" LINK

"Unscrambling spectral interference and matrix effects in Vitis vinifera Vis-NIR spectroscopy: Towards analytical grade 'in vivo'sugars and acids quantification" LINK

"Research Progress of Bionic Materials Simulating Vegetation Visible-Near Infrared Reflectance Spectra" LINK

"Latent Variable Machine Learning Methods Applied for NIR Quantitative Analysis of Coffee" LINK

"Identification of informative spectral ranges for predicting major chemical constituents in corn using NIR spectroscopy" LINK

"Vis-NIR Spectroscopy and Machine Learning Methods for the Discrimination of Transgenic Brassica napus L. and Their Hybrids with B. juncea" LINK

"Applied Sciences : Hidden Information in Uniform Design for Visual and Near-Infrared Spectrum and for Inkjet Printing of Clothing on Canvas to Enhance Urban Security" LINK

"LIONirs: flexible Matlab toolbox for fNIRS data analysis" LINK


Raman Spectroscopy

"Raman Spectroscopic Detection and Quantification of Macro- and Microhematuria in Human Urine" LINK


Hyperspectral Imaging (HSI)

"Prediction of total carotenoids, color and moisture content of carrot slices during hot air drying using noninvasive hyperspectral imaging technique" LINK

"Growth simulation of Pseudomonas fluorescens in pork using hyperspectral imaging" LINK

"Estimation of Leaf Water Content of Different Leaves from Different Species Using Hyperspectral Reflectance Data" LINK


Chemometrics and Machine Learning

"Automation : Predictive Performance of Mobile Vis-NIR Spectroscopy for Mapping Key Fertility Attributes in Tropical Soils through Local Models Using PLS and ANN" LINK

"Prediction of South American Leaf Blight and Disease-Induced Photosynthetic Changes in Rubber Tree, Using Machine Learning Techniques on Leaf Hyperspectral ..." LINK

"Proximal spectroscopy sensing for sugarcane quality prediction and spatial variability mapping" LINK

"Variable Selection Based on Gray Wolf Optimization Algorithm for the Prediction of Saponin Contents in Xuesaitong Dropping Pills Using NIR Spectroscopy" | LINK

"Prediction of soil organic matter content based on characteristic band selection method" LINK

"Sensors : Algorithm of Stability-Analysis-Based Feature Selection for NIR Calibration Transfer" LINK

"Modelling soil water retention and water‐holding capacity with visible-near infrared spectra and machine learning" LINK

"Machine learning for atherosclerotic tissue component classification in combined near-infrared spectroscopy intravascular ultrasound imaging: Validation against ..." LINK

"Modelling soil water retention and waterholding capacity with visiblenear infrared spectra and machine learning" LINK

"Cancers : Novel Non-Invasive Quantification and Imaging of Eumelanin and DHICA Subunit in Skin Lesions by Raman Spectroscopy and MCR Algorithm: Improving Dysplastic Nevi Diagnosis" LINK


Spectroscopy

"Evaluation of portable vibrational spectroscopy for identifying plasticizers in dairy tubing" LINK


Optics for Spectroscopy

"Chemosensors : Carbocyanine-Based Fluorescent and Colorimetric Sensor Array for the Discrimination of Medicinal Compounds" LINK

"Platinum(II)Acetylide Conjugated Polymer Containing AzaBODIPY Moieties for Panchromatic Photodetectors" LINK


Equipment for Spectroscopy

"Polymers : Role of Macrodiols in the Synthesis and Thermo-Mechanical Behavior of Anti-Tack Water Borne Polyurethane Dispersions" LINK


Process Control and NIR Sensors

"A Perfect Pair: Stabilized Black Phosphorous Nanosheets Engineering with Antimicrobial Peptides for Robust Multidrug Resistant Bacteria Eradication" LINK


Environment NIR-Spectroscopy Application

"Long-Term Liming Reduces the Emission and Temperature Sensitivity of N2o Via Altering Denitrification Functional Gene Ratio in Acidic Soil" LINK

"Environmental metabolomics approaches to identify and enhance secondary compounds in medicinal plants for bio-based plant protection" LINK

"Soil moisture determines nitrous oxide emission and uptake" LINK

"Remote Sensing : Evaluating the Capability of Satellite Hyperspectral Imager, the ZY1-02D, for Topsoil Nitrogen Content Estimation and Mapping of Farmlands in Black Soil Area, China" LINK

"Remote Sensing : Extending the GOSAILT Model to Simulate Sparse Woodland Bi-Directional Reflectance with Soil Reflectance Anisotropy Consideration" LINK


Agriculture NIR-Spectroscopy Usage

"Evaluation of Near-Infrared Reflectance and Transflectance Sensing System for Predicting Manure Nutrients" LINK

"Ecoenzymatic stoichiometry reflects the regulation of microbial carbon and nitrogen limitation on soil nitrogen cycling potential in arid agriculture ecosystems" | LINK

"Remote Sensing : Phenotypic Traits Estimation and Preliminary Yield Assessment in Different Phenophases of Wheat Breeding Experiment Based on UAV Multispectral Images" LINK

"Agronomy : Evaluation of Methods for Measuring Fusarium-Damaged Kernels Wheat" LINK

"Agriculture : Non-Destructive Detection of pH Value of Kiwifruit Based on Hyperspectral Fluorescence Imaging Technology" LINK

"Agronomy : Optical Spectrometry to Determine Nutrient Concentrations and other Physicochemical Parameters in Liquid Organic Manures: A Review" LINK

"Agriculture : The Effect of Tytanit on Fibre Fraction Content in Medicago x varia T. Martyn and Trifolium pratense L. Cell Walls" LINK


Horticulture NIR-Spectroscopy Applications

"Redefining the impact of preharvest factors on peach fruit quality development and metabolism: A review" LINK

"Accurate nondestructive prediction of soluble solids content in citrus by nearinfrared diffuse reflectance spectroscopy with characteristic variable selection" LINK


Forestry and Wood Industry NIR Usage

"Spectrometric Prediction of Nitrogen Content in Different Tissues of Slash Pine Trees" LINK


Food & Feed Industry NIR Usage

"Effects of Irrigation Strategy and Plastic Film Mulching on Soil N 2 O Emissions and Fruit Yields of Greenhouse Tomato" LINK

"Mini shortwave Spectroscopic Techniques and Multivariate Statistical Analysis as a Tool for Testing intact Cocoa beans at farmgate for Quality Control in Ghana" LINK

"Foods : Gluten Conformation at Different Temperatures and Additive Treatments" LINK


Pharma Industry NIR Usage

"Revealing the Effect of Heat Treatment on the Spectral Pattern of Unifloral Honeys Using Aquaphotomics" LINK

"Biomedicines : Pathophysiological Response to SARS-CoV-2 Infection Detected by Infrared Spectroscopy Enables Rapid and Robust Saliva Screening for COVID-19" LINK


Other

"Unraveling the potential of phenomic selection within and among diverse breeding material of maize (Zea mays L.)" LINK

"Applied Sciences : Impact of Pheidole fallax (Hymenoptera: Formicidae) as an Ecosystem Engineer in Rehabilitated Coal Mine Areas" LINK

"The Spectral Mixture Residual: A Source of LowVariance Information to Enhance the Explainability and Accuracy of Surface Biology and Geology Retrievals" LINK

"Glycosylated MoS2 Sheets for Capturing and Deactivating E. coli Bacteria: Combined Effects of Multivalent Binding and Sheet Size" LINK


Spectroscopy and Chemometrics News Weekly #44, 2020Spektroskopie und Chemometrie Neuigkeiten Wöchentlich #44, 2020Spettroscopia e Chemiometria Weekly News #44, 2020

NIR Calibration-Model Services

Spectroscopy and Chemometrics News Weekly 43, 2020 | NIRS NIR Spectroscopy MachineLearning Spectrometer Spectrometric Analytical Chemistry Food Analysis Lab Labs Laboratories Laboratory Software IoT Sensors QA QC Testing Quality LINK

Get the "Spectroscopy and Chemometrics News Weekly" in real time on Twitter @ CalibModel and follow us.


Near-Infrared Spectroscopy (NIRS)

"Quality of Eucalyptus benthamii wood for pulp production by Near Infrared Spectroscopy (NIRS)." LINK

"Aplicaciones de la Espectroscopia de Infrarrojo Cercano (NIR) para predecir el contenido y la actividad de agua del embutido tipo “Fuet “" LINK

"Monitoring the Processing of Dry Fermented Sausages with a Portable NIRS Device" LINK

"Modelling potentially toxic elements in forest soils with vis–NIR spectra and learning algorithms" LINK


Infrared Spectroscopy (IR) and Near-Infrared Spectroscopy (NIR)

"Visible and near-infrared hyperspectral imaging techniques allow the reliable quantification of prognostic markers in lymphomas: a pilot study using the Ki67 proliferation index as an example." LINK

"Key variables selection and models development based on near-infrared spectra for the multi-qualities in formula feedstuff for swine." LINK

"Comparison of Reflectance and Interactance Modes of Visible and Near-Infrared Spectroscopy for Predicting Persimmon Fruit Quality" LINK

"Effectiveness of different approaches for in situ measurements of organic carbon using visible and near infrared spectrometry in Poyang basin" LINK

"Near-Infrared Transmittance Spectral Imaging for Nondestructive Measurement of Internal Disorder in Korean Ginseng." LINK

"Deep Spectral-Spatial Features of Near Infrared Hyperspectral Images for Pixel-Wise Classification of Food Products" Sensors LINK

"Confirmation of brand identification in infant formulas by using near-infrared spectroscopy fingerprints." LINK

"Rapid detection of quality of Japanese fermented soy sauce using near-infrared spectroscopy." LINK

"Fast, direct and in situ monitoring of lipid oxidation in an oil-in-water emulsion by near infrared spectroscopy." LINK

"Feasibility of near-infrared spectroscopy as a tool for anatomical mapping of the human epicardium." LINK

"Predicting Marian Plum Fruit Quality without Environmental Condition Impact by Handheld Visible–Near-Infrared Spectroscopy" LINK

"Application of miniaturized near-infrared spectroscopy in pharmaceutical identification" LINK

"Two standard-free approaches to correct for external influences on near-infrared spectra to make models widely applicable" LINK


Hyperspectral Imaging (HSI)

"Selecting Key Wavelengths of Hyperspectral imagine for Nondestructive Classification of Moldy Peanuts using Ensemble Classifier" LINK

"A rapid and non-destructive detection of Escherichia coli on the surface of fresh-cut potato slices and application using hyperspectral imaging" LINK

"Using Machine Learning for Estimating Rice Chlorophyll Content from In Situ Hyperspectral Data" RemoteSensing LINK


Chemometrics and Machine Learning

"Comparison of chemometrics and official AOCS methods for predicting the shelf life of edible oil" LINK

"Study on a twodimensional correlation visiblenear infrared spectroscopy kinetic model for the moisture content of fresh walnuts stored at room temperature" LINK

"Chemometric Strategies for Spectroscopy-Based Food Authentication" LINK

"Development of a Near Infrared Spectroscopy Model for Prediction of Fibre Compounds in Alfalfa" LINK

"Tracing the Geographical Origins of Dendrobe (Dendrobium spp.) by Near-Infrared Spectroscopy Sensor Combined with Porphyrin and Chemometrics" LINK


Equipment for Spectroscopy

"Evaluation of a micro-spectrometer for the real-time assessment of liver graft with mild-to-moderate macrosteatosis: A proof of concept study." hepatology LINK

"Application of a Handheld Near-Infrared Spectrometer to Predict Gelatinized Starch, Fiber Fractions, and Mineral Content of Ground and Intact Extruded Dry Dog Food" Animals LINK


Process Control and NIR Sensors

"Development of analytical methods based on Near Infrared Spectroscopy for monitoring of pharmaceutical and biotechnological processes and control of new ..." LINK

"Nondestructive monitoring of polyphenols and caffeine during green tea processing using VisNIR spectroscopy" LINK


Agriculture NIR-Spectroscopy Usage

"Unique contributions of chlorophyll and nitrogen to predict crop photosynthetic capacity from leaf spectroscopy" LINK

"Online Application of a Hyperspectral Imaging System for the Sorting of Adulterated Almonds" LINK


Food & Feed Industry NIR Usage

"Verifying the Geographical Origin and Authenticity of Greek Olive Oils by Means of Optical Spectroscopy and Multivariate Analysis." LINK

"Non-Destructive Quality Assessment of Tomato Paste by Using Portable Mid-Infrared Spectroscopy and Multivariate Analysis" Foods LINK


Other

"On-board Sensorik zur Erkennung der Kraftstoffzusammen-setzung" LINK


.

NIR Calibration-Model Services

Spektroskopie und Chemometrie Neuigkeiten Wöchentlich 43, 2020 | NIRS NIR Spektroskopie MachineLearning Spektrometer IoT Sensor Nahinfrarot Food Analytik Analysengeräte Analysentechnik Analysemethode Nahinfrarotspektroskopie Laboranalyse LINK

Get the "Spectroscopy and Chemometrics News Weekly" in real time on Twitter @ CalibModel and follow us.


Near-Infrared Spectroscopy (NIRS)

"Quality of Eucalyptus benthamii wood for pulp production by Near Infrared Spectroscopy (NIRS)." LINK

"Aplicaciones de la Espectroscopia de Infrarrojo Cercano (NIR) para predecir el contenido y la actividad de agua del embutido tipo “Fuet “" LINK

"Monitoring the Processing of Dry Fermented Sausages with a Portable NIRS Device" LINK

"Modelling potentially toxic elements in forest soils with vis–NIR spectra and learning algorithms" LINK


Infrared Spectroscopy (IR) and Near-Infrared Spectroscopy (NIR)

"Visible and near-infrared hyperspectral imaging techniques allow the reliable quantification of prognostic markers in lymphomas: a pilot study using the Ki67 proliferation index as an example." LINK

"Key variables selection and models development based on near-infrared spectra for the multi-qualities in formula feedstuff for swine." LINK

"Comparison of Reflectance and Interactance Modes of Visible and Near-Infrared Spectroscopy for Predicting Persimmon Fruit Quality" LINK

"Effectiveness of different approaches for in situ measurements of organic carbon using visible and near infrared spectrometry in Poyang basin" LINK

"Near-Infrared Transmittance Spectral Imaging for Nondestructive Measurement of Internal Disorder in Korean Ginseng." LINK

"Deep Spectral-Spatial Features of Near Infrared Hyperspectral Images for Pixel-Wise Classification of Food Products" Sensors LINK

"Confirmation of brand identification in infant formulas by using near-infrared spectroscopy fingerprints." LINK

"Rapid detection of quality of Japanese fermented soy sauce using near-infrared spectroscopy." LINK

"Fast, direct and in situ monitoring of lipid oxidation in an oil-in-water emulsion by near infrared spectroscopy." LINK

"Feasibility of near-infrared spectroscopy as a tool for anatomical mapping of the human epicardium." LINK

"Predicting Marian Plum Fruit Quality without Environmental Condition Impact by Handheld Visible–Near-Infrared Spectroscopy" LINK

"Application of miniaturized near-infrared spectroscopy in pharmaceutical identification" LINK

"Two standard-free approaches to correct for external influences on near-infrared spectra to make models widely applicable" LINK


Hyperspectral Imaging (HSI)

"Selecting Key Wavelengths of Hyperspectral imagine for Nondestructive Classification of Moldy Peanuts using Ensemble Classifier" LINK

"A rapid and non-destructive detection of Escherichia coli on the surface of fresh-cut potato slices and application using hyperspectral imaging" LINK

"Using Machine Learning for Estimating Rice Chlorophyll Content from In Situ Hyperspectral Data" RemoteSensing LINK


Chemometrics and Machine Learning

"Comparison of chemometrics and official AOCS methods for predicting the shelf life of edible oil" LINK

"Study on a twodimensional correlation visiblenear infrared spectroscopy kinetic model for the moisture content of fresh walnuts stored at room temperature" LINK

"Chemometric Strategies for Spectroscopy-Based Food Authentication" LINK

"Development of a Near Infrared Spectroscopy Model for Prediction of Fibre Compounds in Alfalfa" LINK

"Tracing the Geographical Origins of Dendrobe (Dendrobium spp.) by Near-Infrared Spectroscopy Sensor Combined with Porphyrin and Chemometrics" LINK


Equipment for Spectroscopy

"Evaluation of a micro-spectrometer for the real-time assessment of liver graft with mild-to-moderate macrosteatosis: A proof of concept study." hepatology LINK

"Application of a Handheld Near-Infrared Spectrometer to Predict Gelatinized Starch, Fiber Fractions, and Mineral Content of Ground and Intact Extruded Dry Dog Food" Animals LINK


Process Control and NIR Sensors

"Development of analytical methods based on Near Infrared Spectroscopy for monitoring of pharmaceutical and biotechnological processes and control of new ..." LINK

"Nondestructive monitoring of polyphenols and caffeine during green tea processing using VisNIR spectroscopy" LINK


Agriculture NIR-Spectroscopy Usage

"Unique contributions of chlorophyll and nitrogen to predict crop photosynthetic capacity from leaf spectroscopy" LINK

"Online Application of a Hyperspectral Imaging System for the Sorting of Adulterated Almonds" LINK


Food & Feed Industry NIR Usage

"Verifying the Geographical Origin and Authenticity of Greek Olive Oils by Means of Optical Spectroscopy and Multivariate Analysis." LINK

"Non-Destructive Quality Assessment of Tomato Paste by Using Portable Mid-Infrared Spectroscopy and Multivariate Analysis" Foods LINK


Other

"On-board Sensorik zur Erkennung der Kraftstoffzusammen-setzung" LINK


.

NIR Calibration-Model Services

Spettroscopia e Chemiometria Weekly News 43, 2020 | NIRS VisNIR Spettroscopia MachineLearning analisi chimica Spettrale Spettrometro Chem IoT Sensore Attrezzatura analitica Laboratorio analisi prova qualità Analysesystem QualityControl LINK

Get the "Spectroscopy and Chemometrics News Weekly" in real time on Twitter @ CalibModel and follow us.


Near-Infrared Spectroscopy (NIRS)

"Quality of Eucalyptus benthamii wood for pulp production by Near Infrared Spectroscopy (NIRS)." LINK

"Aplicaciones de la Espectroscopia de Infrarrojo Cercano (NIR) para predecir el contenido y la actividad de agua del embutido tipo “Fuet “" LINK

"Monitoring the Processing of Dry Fermented Sausages with a Portable NIRS Device" LINK

"Modelling potentially toxic elements in forest soils with vis–NIR spectra and learning algorithms" LINK


Infrared Spectroscopy (IR) and Near-Infrared Spectroscopy (NIR)

"Visible and near-infrared hyperspectral imaging techniques allow the reliable quantification of prognostic markers in lymphomas: a pilot study using the Ki67 proliferation index as an example." LINK

"Key variables selection and models development based on near-infrared spectra for the multi-qualities in formula feedstuff for swine." LINK

"Comparison of Reflectance and Interactance Modes of Visible and Near-Infrared Spectroscopy for Predicting Persimmon Fruit Quality" LINK

"Effectiveness of different approaches for in situ measurements of organic carbon using visible and near infrared spectrometry in Poyang basin" LINK

"Near-Infrared Transmittance Spectral Imaging for Nondestructive Measurement of Internal Disorder in Korean Ginseng." LINK

"Deep Spectral-Spatial Features of Near Infrared Hyperspectral Images for Pixel-Wise Classification of Food Products" Sensors LINK

"Confirmation of brand identification in infant formulas by using near-infrared spectroscopy fingerprints." LINK

"Rapid detection of quality of Japanese fermented soy sauce using near-infrared spectroscopy." LINK

"Fast, direct and in situ monitoring of lipid oxidation in an oil-in-water emulsion by near infrared spectroscopy." LINK

"Feasibility of near-infrared spectroscopy as a tool for anatomical mapping of the human epicardium." LINK

"Predicting Marian Plum Fruit Quality without Environmental Condition Impact by Handheld Visible–Near-Infrared Spectroscopy" LINK

"Application of miniaturized near-infrared spectroscopy in pharmaceutical identification" LINK

"Two standard-free approaches to correct for external influences on near-infrared spectra to make models widely applicable" LINK


Hyperspectral Imaging (HSI)

"Selecting Key Wavelengths of Hyperspectral imagine for Nondestructive Classification of Moldy Peanuts using Ensemble Classifier" LINK

"A rapid and non-destructive detection of Escherichia coli on the surface of fresh-cut potato slices and application using hyperspectral imaging" LINK

"Using Machine Learning for Estimating Rice Chlorophyll Content from In Situ Hyperspectral Data" RemoteSensing LINK


Chemometrics and Machine Learning

"Comparison of chemometrics and official AOCS methods for predicting the shelf life of edible oil" LINK

"Study on a twodimensional correlation visiblenear infrared spectroscopy kinetic model for the moisture content of fresh walnuts stored at room temperature" LINK

"Chemometric Strategies for Spectroscopy-Based Food Authentication" LINK

"Development of a Near Infrared Spectroscopy Model for Prediction of Fibre Compounds in Alfalfa" LINK

"Tracing the Geographical Origins of Dendrobe (Dendrobium spp.) by Near-Infrared Spectroscopy Sensor Combined with Porphyrin and Chemometrics" LINK


Equipment for Spectroscopy

"Evaluation of a micro-spectrometer for the real-time assessment of liver graft with mild-to-moderate macrosteatosis: A proof of concept study." hepatology LINK

"Application of a Handheld Near-Infrared Spectrometer to Predict Gelatinized Starch, Fiber Fractions, and Mineral Content of Ground and Intact Extruded Dry Dog Food" Animals LINK


Process Control and NIR Sensors

"Development of analytical methods based on Near Infrared Spectroscopy for monitoring of pharmaceutical and biotechnological processes and control of new ..." LINK

"Nondestructive monitoring of polyphenols and caffeine during green tea processing using VisNIR spectroscopy" LINK


Agriculture NIR-Spectroscopy Usage

"Unique contributions of chlorophyll and nitrogen to predict crop photosynthetic capacity from leaf spectroscopy" LINK

"Online Application of a Hyperspectral Imaging System for the Sorting of Adulterated Almonds" LINK


Food & Feed Industry NIR Usage

"Verifying the Geographical Origin and Authenticity of Greek Olive Oils by Means of Optical Spectroscopy and Multivariate Analysis." LINK

"Non-Destructive Quality Assessment of Tomato Paste by Using Portable Mid-Infrared Spectroscopy and Multivariate Analysis" Foods LINK


Other

"On-board Sensorik zur Erkennung der Kraftstoffzusammen-setzung" LINK


.

NIR-Predictor – Manual


NIR-Predictor – Manual

Predicting Spectra

It’s easy to use with NIR-Predictor,
just drag & drop your data for getting the prediction results.

It supports an automatic file format detection.
So you don’t need to specify the instrument type and settings! See the list of supported formats and NIR Vendors: NIR-Predictor supported Spectral Data File Formats

Use the included data to checkout how it feels:

  1. Open the demo Spectra folder by using the Menu > Open Demo Spectra or press F8.
    There are files with spectra from different Vendors.
  2. Drag & drop a spectra file onto the NIR-Predictor window (or press Ctrl+O as for ’Open some files).
  3. The spectra will be
    • loaded
    • pre-processed
    • predicted and
    • reported

Note:
All the steps are fully automatic.
All calibrations that are compatible with the spectra, will produce prediction results in one go.
To select specific calibrations choose the Application. Where the ” ” empty means use all the calibrations.
To define a Application read more in chapter “Applications”

Hint:
To get access to Statistics of Predictions and Reports use the Menu > Show more/less (Ctrl+M) or you can simply resize the window. Here you can also re-do the Analyze step manually with changed inputs (e.g. Result Ordering).


Creating your own Calibrations

How it works – step by step

  1. You have measured your samples with you NIR-Instrument Software.
    And got the Lab-values of these samples.

    samples
    -> measured NIR-spectra
    -> Lab-references analytics

  2. Now you need to combine these data.

    NIR-spectra + Lab-references
    -> PropertiesBySamples

    Note: If you combined these data already in your NIR software used,
    and you can export it as a JCAMP-DX file then use
    Menu > Create Request File .req ... (F2)
    and read the “Help.html” and NIR-Predictor JCAMP.
    Else proceed as below.

    The NIR-Predictor provides tooling for that:

    Menu > Create Properties File... (F6)

    Select the folder with your NIR spectra measured for an application.
    NIR-Predictor creates a customized Properties file template for that data to enter the Lab values.

    Note: You don’t need to specify your instrument or vendor or an application. It’s all done automatically. And also the sample spectra are detected and grouped automatically!

  3. Use your favorite editor or spreadsheet program to enter and copy&paste
    the Lab-references Values into the columns “Prop1”, “Prop2” etc. and save the file.
  4. A final check of your entered data is done by NIR-Predictor,
    to make sure your data ist complete and all is fine.

    Menu > Create Calibration Request... (F7)

    Select the folder with the filled file.
    A CalibrationRequest.zip is created with the necessary data
    if enougth diverse Lab values are entered.

  5. Email the CalibrationRequest.zip file
    to info@CalibrationModel.com to develop the calibrations.
  6. When your calibrations are ready, you will receive an email with a link
    to the CalibrationModel WebShop where
    you can purchase and download the calibration files,
    that work with our free NIR-Predictor software without internet access.

    Note: Your sent NIR data is deleted after processing.
    We do not collect your NIR data!

Note: Further details can be found under “Create Properties File” and “Create Calibration Request”.


Configure the Calibrations for prediction usage

Configuration:

  1. in NIR-Predictor : Menu > Open Calibrations (F9)
  2. an explorer window is opened where the calibrations are located
  3. create a folder for your application, choose a name
  4. copy the calibration file(s) (*.cm) into that folder
  5. in NIR-Predictor : Menu > Search and load Applications (F4)

Usage:

  1. in NIR-Predictor : open the Application drop down list, and select your application by name
  2. if all is fine, the calibration file is valid and not expired, it shows : Calibration “1 valid calibation”
  3. the NIR-Predictor is now ready to predict
  4. to switch the application, goto 6.

Applications

The Application concept allows to group multiple Calibrations together for an Application. By selecting an Application before prediction, only the Calibrations belonging to the Application will be used for Prediction. In the Demo Data this is used to have multiple spectrometer as Application. This can be used easily as e.g. as Application “Meat Products” containing Fat and Moisture Calibration.

To create an Application, create a folder with the Application’s name inside the Calibrations folder, and move/copy all the Calibrations files to this Application folder. To remove a Calibration from the Application, remove the Calibration file from the Application folder.

After creating an new Application folder, press menu Search and load Applications (F4) to update the NIR-Predictor dialog where the Application can be selected via the dropdown list. You don’t need to close the NIR-Predictor.

After moving Calibration files around, press menu Search and load Calibrations (F5) to update the NIR-Predictor dialog.

The use-all case

In the NIR-Predictor dialog where the Application can be selected via the dropdown list, the empty "" name means that all (yes all) valid Calibrations will be used for prediction.

Note: The Prediction Report will contain only results from spectral compatible Calibrations with the given spectra. That allows to automatically handle the multi vendor NIR instrument usage.


Prediction Result Report

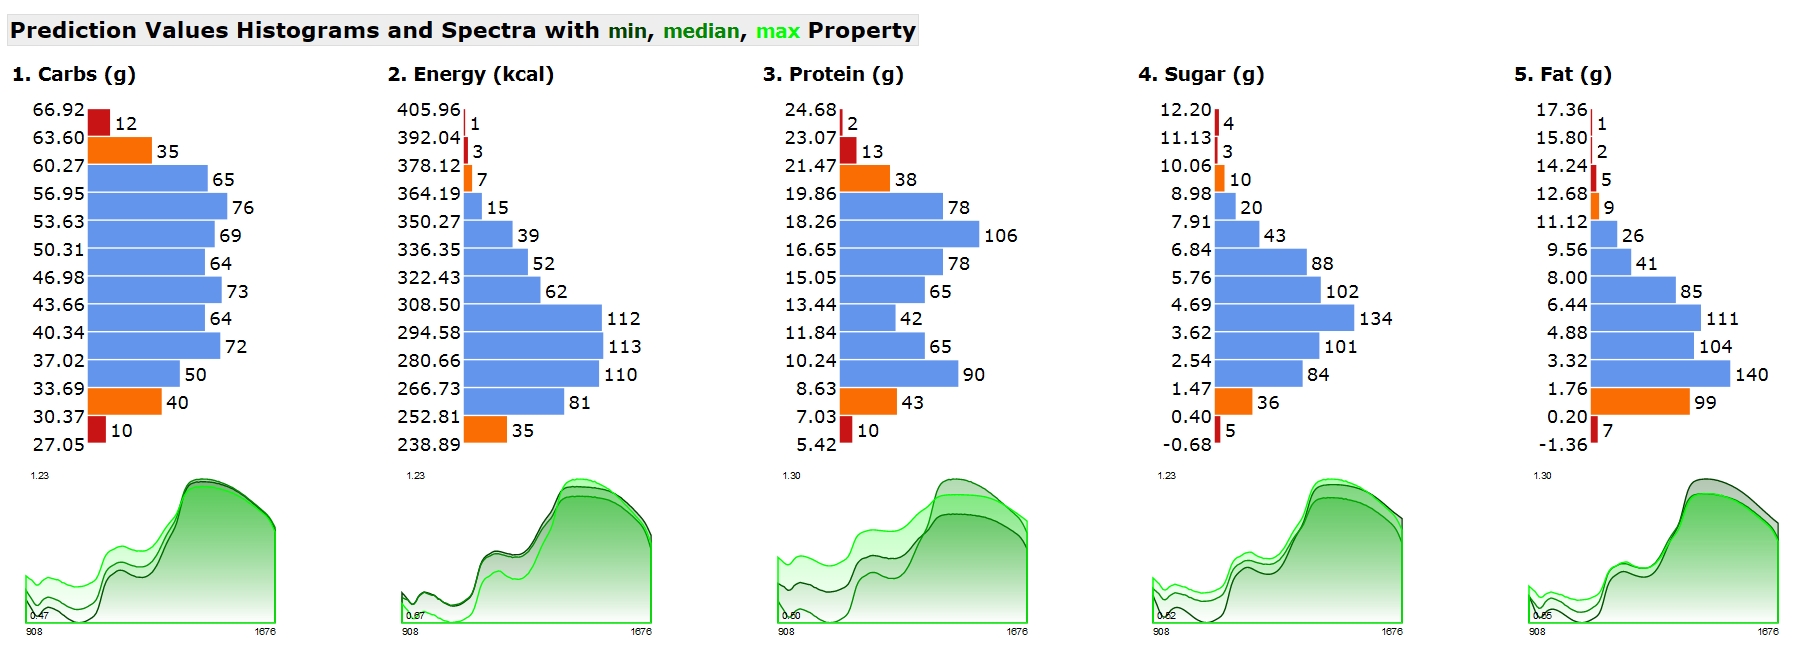
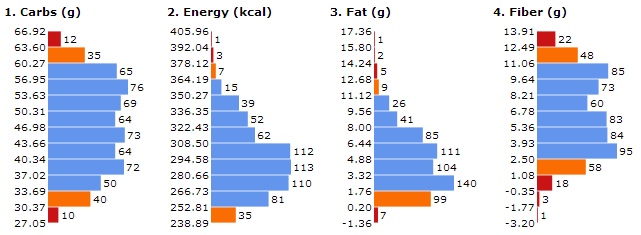
Histograms of Prediction Values per Property

Shows the distribution of the predicted results per calibration. The histogram range contains the range of the calibrated property and includes the predicted results.

The histogram bar (bin) color is defined as follow:

  • blue : all predictions inside calibration range.
  • red : all predictions outside calibration range.
  • orange : some overlaps with calibration range.
    So not all spectra in a orange bin are outside calibration range.
Histograms

Note: Predicted values are always shown in Histogram table and Prediction Value List table, even if the spectrum does not fit into model (spectrum different to model, aka Residual Outlier) shown as Out = X.

Note: Old browsers like Microsoft Internet Explorer 11 don’t support the grafics for Histogram charts. Use an current browser like Firefox or Chrome or Edge.

Note: If your browser opens the report too slow, try to deactivate some browser plugins, because they can filter what you look at and some add-ons are really slow.

Spectra Plot Thumbnail on the Prediction Report

Visualizes the min,median,max spectrum of the spectra dropped as files on the NIR-Predictor. This gives a minimal and good spectral overview of the predicted property results.

  • Spectra Plot color legend: min,median,max spectrum by predicted property or if no calibration is available by spectral intensity.
  • The min,median,max is determined from the predicted properties or if not available from the intensity of the spectra.
  • Beside the histogram of the predicted properties, where the distribution can be seen, the spectra shown are the ones from min,median,max predicted property.
  • This gives a minimal and good spectral overview of the predicted property results.
  • The “Spectral Range” and number of datapoints is shown in the Prediction Report Header below the listed spectra files.
  • To zoom the spectra plot a little, zoom the report in the browser (hold ctrl + mouse wheel, or pinch on touch screen).
  • The spectra plots and histograms are stored with the report and can be archived.

Note

  • Note that the spectra are shown in the raw values that are loaded, they are not shown pre-processed as the calibration model uses them to make the prediction.
  • Note that the median property spectrum is the median from the predicted property pobulation and not the “median” of the calibration property range.
  • Note that in the multi calibration prediction case, the spectra are selected for each property based on the related predicted property values and so the spectra plots shows typical different spectra.
Spectra Plot

Outlier Detection

To safeguard the prediction results, outliers are automatically checked for each individual prediction. This is based on limits that are determined when creating the calibration with the base data. Thus, a strange spectral measurement can be detected and signaled as an outlier even without base data only by means of the calibration and the NIR predictor. A prediction result with outlier warning is to be distrusted. How the various outlier tests are interpreted and how to avoid them in practice is described here.

The spectrum is an outlier to the model, if the spectrum is not similar with the spectra and lab-values the model is built with.

This legend is shown on each NIR-Predictor prediction report below the results:

Outlier (Out) Symbol Description

  • “X” : spectrum does not fit into model (spectrum different to model)
  • “O” : spectrum is wide outside model center (spectrum similar to model but far away)
  • “=” : prediction is outside upper or lower range of model (property outside model range)
  • “-” : spectrum is incompatible to calibration

Note: A prediction result with outlier warning is to be distrusted.

There are 3 outlier cases (X, O, =) and the incompatible data case “-”.

  • The bad case is “X”
  • the medium case is “O”
  • and the soft case is “=”.

The technical names in literature correspond to:

  • “X” : Spectral Residual Outlier
  • “O” : Leverage Outlier
  • “=” : Property Range Outlier

These 3 outlier cases can appear in combinations, like “XO=” or “XO” or “O=” or “X=”. The more outlier marker are shown the more likely the spectrum is an Outlier.

The default setting in NIR-Predictor Menu > “Report with Simplified Outlier Symbols”

  • is ON, that will show only the worst case instead of all combinations to have a simplified minimal information.
  • if OFF, that will show the combinations (e.g. “XO=” or “XO” or “O=” or “X=”), which is more informative for analyzing problem cases.

Some hints to avoid these Outliers:

  • “X” : spectrum does not fit into model (spectrum different to model)
    Check if the spectrum is noise only, or has no proper signal. That can happen when measured past the sample or measured into the air or at a different substance. If you have multiple NIR instruments of the same type, use spectra measured with different instruments for the calibration.
  • “O” : spectrum is wide outside model center (spectrum similar to model but far away) Sample temperature has an effect on NIR spectra shape, use spectra measured at different (typical use) temperatures (sample temperature, instrument temperature).
  • “=” : prediction is outside upper or lower range of model (property outside model range)
    Use more spectra for the calibration in the Lab value region where your special interest is. If the predicted value is only a little bit out of the calibration range, it can be Ok. Add these spectra to the calibration spectra (with the Lab values), to extend the prediction range of the calibration.
  • “-” : spectrum is incompatible to calibration
    The spectra (from the NIR instrument) has a different wavelength range or a different resolution than the spectra used for calibration. Check Instrument settings (wavelength range, resolution)

Result Ordering

To change the ordering, a drop-down-box is located below the Analyze button. If there is an analysis from the current session, and the Result Ordering is changed, the data is re-Analyzed and reported with the new Result Ordering setting. That allows to compare the different orderings. The Result Ordering is listed in the Prediction Report above the Prediction Value List and stored in the settings.

The order/sorting of the prediction results of the spectra can be defined:

  • GivenOrder (default) the given order of the spectra from file select dialog or drag&drop

*) sorted : ascending sort

  • Date_Name sorted by Date (if any) and then by Name
  • Name_Date sorted by Name and then by Date
  • Date_NamesWithNumbers sorted by Date (if any) and then by Name with number logic
  • NamesWithNumbers_Date sorted by Name with number logic (e.g. “ABC1” is before “ABC002” ) and then by Date

*) as above but sorted Rev : reverse sort = descending sort

  • Rev_Date_Name
  • Rev_Name_Date
  • Rev_Date_NamesWithNumbers
  • Rev_NamesWithNumbers_Date

E.g. with reverse sort by Rev_Date_Name, the newest spectra appear on top.

Depending on how many calibrations are used the result table is getting broader. To print the report (e.g. to Adobe PDF, FreePDF or Microsoft XPS), sometimes the landscape format is shorter in number of pages or in portrait a scale of 80% fits nicely. Or try another internet browser (Mozilla Firefox, Google Chrome, Microsoft Edge, …) to print the report and set the browser as your default browser so it will be opened by default.

Archiving Reports

Each report is contained in one file only, including the grafics. To save storage space the report file folder can be compressed to a zip file (.zip, .7z).


Enter lab values to NIR spectra

Entering the laboratory reference values for NIR calibrations

We have developed specialized tools into NIR-Predictor to combine the NIR and Lab data is a sample-based safe manner.

The main target is to improve Data Quality during the step of combining of the Lab data and the NIR data, because to model a good reliable calibration the data that build the base needs to be of high quality.

It also simplifies to enter the lab values manually to the corresponding NIR data, because of automatically grouping repeated NIR measurements of the same sample, so the lab values can be entered sample based and not by spectrum.

It helps to avoid false reference data, because of the broken relation of NIR spectra and reference values, data entry on the wrong position in the table.

And Helps to detect errors of duplicated or multiple copies of spectra files, and checks for inconsistencies in Date-Time and Sample-Naming. It also checks for missing values.

That all increases the Data Quality for the next step of Calibration Development, and makes data entry a less time consuming and less risky work.

How it works

  1. Menu > Create Properties File... (F6) select the folder with your NIR spectra measured for an application. NIR-Predictor creates a Properties file template for that data : PropertiesBySamples.csv.txt
  2. Use your favorite editor or spreadsheet program to enter and copy&paste the Lab Values into the columns and save the file.
  3. Menu > Create Calibration Request... (F7) select the folder with the filled file for a last check and a Calibration Request file is created with the needed data as a single zip file.
  4. Email the Calibration Request file to info@CalibrationModel.com to develop the calibrations.

Ok that is it, the NIR-Predictor guides you through the steps needed. And if you need to know more details, the Chapter “Create Properties File” is for you.

Create Properties File

Note:

  • If you have (exported) JCAMP-DX files containing the Lab-Values, you don’t need to do this step.
    You can send the JCAMP file with your Request (.req) file directly to the calibration service at info@CalibrationModel.com.
  • If your JCAMP-DX files does NOT contain Lab-Values, this is a way to go.

For calibrating the spectra to the lab-values you need to assign the lab-values to the spectra. The easiest way is to have a table where each spectrum (row) is linked to multiple lab-values (columns). This function Create Properties File build such a table for the selected spectra folder automatically!

This table is stored in the file PropertiesBySamples.csv.txt. This can be created for any spectra folder you like. The file extension is .csv.txt to make it easy to edit in a text editor and also in a spreadsheet (excel). The columns are standard TAB separated.

The file header line contains :

Sample Replicates Names Prop1 Prop2 Prop3 DateFirst DateLast Hashes

Where Name and Date describes the spectrum.

Prop1, Prop2, Prop3 are the place to enter the Lab Reference Concentrations properties corresponding to each spectrum. It can be extended to Prop4, Prop5, … etc. Of course you can enter real word names like “Fat (%)” instead of “Prop1”. It’s recommended to put the measurement unit beside the name.

Replicates is the number of replicated or repeated spectra of a sample that is grouped together in the Sample based property file. Sample name and the DateFirst / DateLast between the sample spectra are measured.

Date format is ISO-8601. Missing Dates are 0002-02-02T00:00:00.0000000.

If the file PropertiesBySamples.csv.txt already exist in the selected folder, the user will be notified (it will not be overwritten, because the file may contain user entered Lab-values). The Lab Reference Concentrations values are initialized to 0 (zero) and needed to be changed.

Note: 0 is not interpreted as missing value! If you have a 0 concentration value, put in 0 or 0.0 .

The entry of properties is as easy as possible, because it’s organized by Sample (and not by Spectra), so it’s like your Lab-Value Table that is sample based. The sample rows are sorted in a special way by Sample name. Sorting by Date or alphabetically by Sample can done easily in a spreadsheet program.

Note: when coping lab values to the samples make sure they correspond, so that there are no gaps and the sorting is the same.

The Spectra (rows) are initially sorted by name (and date) to have the replicates/repeats together. You can sort for your convenience in a spreadsheet program.

Enter the Lab Reference Concentrations to the spectra/sample.

Enter the Lab-Values in spreadsheet (e.g. Excel) or a text editor (e.g. Notepad++). If done, use the next menu Create Calibration Request.

Hints: Data handling:

  • The NIR-Predictor creates the PropertiesBySamples.csv.txt once, after that the user is responsible for its content. That means NIR-Predictor does not change this file anymore.
  • You can remove entire rows (spectra) in the property file. You don’t need to remove the spectra files. The NIR-Predictor is aware of the relation, the PropertiesBySamples.csv.txt defines what will be calibrated.
  • How to add more spectra files?

    The additional spectra can be handled in a separate folder, create the property file and copy the spectra to the other folder and copy/merge the property files together in your editor or spreadsheet.

    Or

    Copy the spectra into the folder, rename the PropertiesBySamples.csv.txt to e.g. “PropertiesBySamples-Part1.csv.txt” and use Create Properties File to create a new PropertiesBySamples.csv.txt with all the spectra. You can copy/merge the content of the Properties files together in your editor or spreadsheet.

  • What happens with possible duplicate rows? It does no harm to the Calibration because we do an exact checking and data cleaning in the calibration process.
  • What happens to duplicate spectra names? The spectra names are not relevant for the calibration process. The spectra names are helpful to assign the lab-values to the corresponding spectrum entry. That’s why the table is initially sorted by name. The spectra names can be edited by the user.

Create Calibration Request

The menu function Create Calibration Request packs a created Properties file (see “Create Properties File”) and it’s linked spectra files in a compressed ZIP file for sending to the CalibrationModel.com Service.

Please note that the number of measured quantitative samples need to be at least 60 . That means you need at least 60 different spectra (not counting the replicate/repeated measurements).

It shows additional property information about the data you have entered, like – the property type (Quantitative) – it’s range (min – max) and – the number of unique values and – if the Lab-values are enough diverse to get calibrated.

First select the folder with the PropertiesBySamples.csv.txt and measured spectra files of samples you have Lab-values. The data is checked and you get notified what is missing or might be wrong. If something needs to be changed, edit the PropertiesBySamples.csv.txt and do Create Calibration Request again. Your last selected folder is remembered, so you can press return in the folder selection dialog.

Hint: The keyboard shortcuts for redoing it after you edited some entries is : F7 Return – that allows you to get the property information quickly.

Hint: If you open the PropertiesBySamples.csv.txt in a spreadsheet program, you can create Histogram plots of the entered Lab-values, to see in which range are to less samples measurements.

When all is fine

When all is fine the “CalibrationRequest.zip” file is created for that data.

The ZIP file contains:

  • your PropertiesBySamples.csv.txt
  • your personal REQuest file for your computer system, that looks like
    e.g. “337dcdc06b2d6dfb0b5c4bba578642312edf2ae84d909281624d7e26283e8b07 WIN-GB0PB48GSK4.req”
  • the spectra data files

Note: If the CalibrationRequest.zip file is already created and you change the PropertiesBySamples.csv.txt make sure to delete the old CalibrationRequest.zip file first! In the dialog it states if it was successfully created or NOT because it already exist. So you are always on the safe side.

Note: CalibrationRequest.zip file name contains the property names to know what would be calibrated and at the end an identification number for referencing the file. E.g. “CalibrationRequest ‘Prop1’ – ‘Prop2’ h31T3wOH.zip”


Program Settings

  • The users program settings are stored in UserSettings.json
  • The program counters are stored in GlobalCounters.json

Further References

NIR-Predictor Download

The free NIR-Predictor software
  • comes with demo data, so you can predict sample spectra with demo calibrations.
  • has no functional limitations, no nagging, no ads and needs no license-key.
  • you need no account and no registration to download and use.
  • runs on Microsoft Windows 10/8/7 (Starter, Basic, Professional) (32 bit / 64 bit).
  • no data is ever transmitted from your local machine. We don't even collect usage data.
See more Videos Beside the free NIR-Predictor software with Windows user interface, the real-time Predictor Engine is also available
  • for embedded integration in application, cloud and instrument-software (ICT).
  • As a light-weigt single library file (DLL) with application programming interface (API), documentation and software development kit (SDK) including sample source code (C#).
  • Easy integration and deployment, no software license protection (no serial key, no dongle).
  • Put your spectrum as an array into the multivariate predictor, no specific file format needed.
  • Fast prediction speed and low latency because of compiled code library (direct call, no cloud API).
  • Protected prediction results with outlier detection information.
See NIR Method Development Service for Labs and NIR-Vendors (OEM, White-Label)
Software Size Date Comment
NIR-Predictor V2.6.0.2 (download) What's new, see Release Notes By downloading and/or using the software you accept the Software License Agreement (EULA) 3.7 MB 18.08.2021 public release
Minimal System Requirements Windows 7 Starter 32Bit, 1.6 GHz, 2 GB RAM, non-Administrator account Installation There are no administrator rights required, unpack the zip file to a folder "NIR-Predictor" in your documents or on your desktop. Read the ReadMe.txt and double click the NIR-Predictor.exe file. Upgrade If you have installed an older version of NIR-Predictor then unpack into a different folder named e.g. "NIR-PredictorVx.y". All versions can run side-by-side. Copy the Calibrations in use to the new version into the "Calibration" folder. That's all. Uninstall Make sure to backup your reports and calibrations inside your "NIR-Predictor" folder. Delete the "NIR-Predictor" folder. Start Calibrate See also:

The free NIR-Predictor software
  • comes with demo data, so you can predict sample spectra with demo calibrations.
  • has no functional limitations, no nagging, no ads and needs no license-key.
  • you need no account and no registration to download and use.
  • runs on Microsoft Windows 10/8/7 (Starter, Basic, Professional) (32 bit / 64 bit).
  • no data is ever transmitted from your local machine. We don't even collect usage data.
See more Videos Neben der kostenlosen NIR-Predictor-Software mit Windows-Benutzeroberfläche ist die Echtzeit-Predictor-Engine auch verfügbar
  • für die eingebettete Integration in Applikations-, Cloud- und Geräte-Software (ICT).
  • Als leichtgewichtige Einzelbibliotheksdatei (DLL) mit Anwendungsprogrammier-Schnittstelle (API), Dokumentation und Software Development Kit (SDK) inklusive Beispiel-Quellcode (C#).
  • Einfache Integration und Bereitstellung, kein Software-Lizenzschutz (kein Serienschlüssel, kein Dongle).
  • Geben Sie Ihr Spektrum als Array in den multivariaten Prädiktor ein, es ist kein spezielles Dateiformat erforderlich.
  • Schnelle Vorhersagegeschwindigkeit und niedrige Latenz aufgrund der kompilierten Code-Bibliothek (direkter Aufruf, keine Cloud-API).
  • Geschützte Vorhersageergebnisse mit Informationen zur Ausreißererkennung.
Siehe NIR-Methodenentwicklungsservice für Labore und NIR-Anbieter (OEM, White-Label)
Software Size Date Comment
NIR-Predictor V2.6.0.2 (download) What's new, see Release Notes By downloading and/or using the software you accept the Software License Agreement (EULA) 3.7 MB 18.08.2021 public release
Minimal System Requirements Windows 7 Starter 32Bit, 1.6 GHz, 2 GB RAM, non-Administrator account Installation There are no administrator rights required, unpack the zip file to a folder "NIR-Predictor" in your documents or on your desktop. Read the ReadMe.txt and double click the NIR-Predictor.exe file. Upgrade If you have installed an older version of NIR-Predictor then unpack into a different folder named e.g. "NIR-PredictorVx.y". All versions can run side-by-side. Copy the Calibrations in use to the new version into the "Calibration" folder. That's all. Uninstall Make sure to backup your reports and calibrations inside your "NIR-Predictor" folder. Delete the "NIR-Predictor" folder. Start Calibrate See also:

The free NIR-Predictor software
  • comes with demo data, so you can predict sample spectra with demo calibrations.
  • has no functional limitations, no nagging, no ads and needs no license-key.
  • you need no account and no registration to download and use.
  • runs on Microsoft Windows 10/8/7 (Starter, Basic, Professional) (32 bit / 64 bit).
  • no data is ever transmitted from your local machine. We don't even collect usage data.
See more Videos Oltre al software gratuito NIR-Predictor con interfaccia utente Windows, il Predictor Engine in tempo reale è disponibile anche
  • per l'integrazione embedded in applicazioni, cloud e strumenti-software (ICT).
  • Come un singolo file di libreria leggera (DLL) con interfaccia di programmazione dell'applicazione (API), documentazione e kit di sviluppo del software (SDK) incluso il codice sorgente di esempio (C#).
  • Facile integrazione e distribuzione, nessuna protezione della licenza software (nessuna chiave seriale, nessun dongle).
  • Inserisci il tuo spettro come array nel predittore multivariato, non è necessario alcun formato di file specifico.
  • Velocità di predizione veloce e bassa latenza grazie alla libreria di codice compilata (chiamata diretta, nessuna API cloud).
  • Risultati di predizione protetti con informazioni di rilevamento degli outlier.
Vedi Servizio di sviluppo del metodo NIR per laboratori e fornitori NIR (OEM, White-Label)
Software Size Date Comment
NIR-Predictor V2.6.0.2 (download) What's new, see Release Notes By downloading and/or using the software you accept the Software License Agreement (EULA) 3.7 MB 18.08.2021 public release
Minimal System Requirements Windows 7 Starter 32Bit, 1.6 GHz, 2 GB RAM, non-Administrator account Installation There are no administrator rights required, unpack the zip file to a folder "NIR-Predictor" in your documents or on your desktop. Read the ReadMe.txt and double click the NIR-Predictor.exe file. Upgrade If you have installed an older version of NIR-Predictor then unpack into a different folder named e.g. "NIR-PredictorVx.y". All versions can run side-by-side. Copy the Calibrations in use to the new version into the "Calibration" folder. That's all. Uninstall Make sure to backup your reports and calibrations inside your "NIR-Predictor" folder. Delete the "NIR-Predictor" folder. Start Calibrate See also: