Spectroscopy and Chemometrics/Machine-Learning News Weekly #11, 2023

Get the Spectroscopy and Chemometrics News Weekly in real time on Twitter @ CalibModel and follow us.

NIR Calibration-Model Services

Spectroscopy and Chemometrics News Weekly 10, 2023 | NIRS NIR Spectroscopy MachineLearning Spectrometer Spectrometric Analytical Chemistry Chemical Analysis Lab Labs Laboratories Laboratory Software IoT Sensors QA QC Testing Quality LINK

Spektroskopie und Chemometrie Neuigkeiten Wöchentlich 10, 2023 | NIRS NIR Spektroskopie MachineLearning Spektrometer IoT Sensor Nahinfrarot Chemie Analytik Analysengeräte Analysentechnik Analysemethode Nahinfrarotspektroskopie Laboranalyse LINK

Spettroscopia e Chemiometria Weekly News 10, 2023 | NIRS NIR Spettroscopia MachineLearning analisi chimica Spettrale Spettrometro Chem IoT Sensore Attrezzatura analitica Laboratorio analisi prova qualità Analysesystem QualityControl LINK

Near-Infrared Spectroscopy (NIRS)

“Near-Infrared Metabolomic Fingerprinting Study of Lichen Thalli and Phycobionts in Culture: Aquaphotomics of Trebouxia lynnae Dehydration” | LINK

“Novel method for the detection of adulterants in coffee and the determination of a coffee’s geographical origin using near infrared spectroscopy complemented by an …” LINK

“Remote Sensing : Comparison of Phenological Parameters Extracted from SIF, NDVI and NIRv Data on the Mongolian Plateau” LINK

“Support vector machine-based rapid detection and quantification of butter yellow adulteration in mustard oil using NIR spectra” | LINK

“Foods : Application of Near-Infrared Spectroscopy and Hyperspectral Imaging Combined with Machine Learning Algorithms for Quality Inspection of Grape: A Review” | LINK

“Forests : Improved Soil Organic Carbon Prediction in a Forest Area by Near-Infrared Spectroscopy: Spiking of a Soil Spectral Library” | LINK

“Foods : Non-Destructive Detection of Meat Quality Based on Multiple Spectral Dimension Reduction Methods by Near-Infrared Spectroscopy” LINK

“Integrated system of an optical cryostat and single-photon detectors for applications in near infrared spectroscopy of quantum emitters” LINK

“The potential of near infrared reflectance spectroscopy (NIRS) for the estimation of quality parameters in tomato paste” | LINK

“Ultrathin TwoDimensional BiOClBi2S3Cu2S Ternary Heterostructures with Enhanced LSPR effect for NIR Photonic Bacterial Disinfection” LINK

“Novel method for the detection of adulterants in coffee and the determination of a coffee’s geographical origin using near infrared spectroscopy complemented by an autoencoder” LINK

“Resolving Near-Infrared Spectra by Generalized Window Factor Analysis for Understanding Interactions in Aqueous Solution” LINK

“Feature Reduction for the Classification of Bruise Damage to Apple Fruit Using a Contactless FT-NIR Spectroscopy with Machine Learning” | LINK

“Early detection of Verticillium wilt of potatoes using near-infrared spectroscopy and machine learning modeling” LINK

Infrared Spectroscopy (IR) and Near-Infrared Spectroscopy (NIR)

“Application of portable near‐infrared spectroscopy technology for grade identification of Panax notoginseng slices” LINK

“Detection and discrimination of sedative-hypnotics in spiked beverage dry residues using attenuated total reflectance-Fourier transform infrared (ATR-FTIR) spectroscopy combined with chemometrics” LINK

“Pendugaan Kandungan Kimia Minyak Goreng Menggunakan Near Infrared Spectroscopy” LINK

“Development of a smart spectral analysis method for the determination of mulberry (Morus alba var. nigra L.) juice quality parameters using FTIR spectroscopy” LINK

“Correlating near infrared data for improved polyolefin recycling” LINK

“Application of portable nearinfrared spectroscopy technology for grade identification of Panax notoginseng slices” LINK

Hyperspectral Imaging (HSI)

“Foods : Visual Monitoring of Fatty Acid Degradation during Green Tea Storage by Hyperspectral Imaging” | LINK

“Foods : Hyperspectral Imaging with Machine Learning Approaches for Assessing Soluble Solids Content of Tribute Citru” | LINK

“Hyperspectral Imaging Coupled with Multivariate Analyses for Efficient Prediction of Chemical, Biological and Physical Properties of Seafood Products” | LINK

Terahertz Spectroscopy

“Terahertz frequency-domain sensing combined with quantitative multivariate analysis for pharmaceutical tablet inspection” LINK

Chemometrics and Machine Learning

“A Rapid Method for Authentication of Macroalgae Based on Vis-NIR Spectroscopy Data Combined with Chemometrics Approach” LINK

“Machine learning-based prediction of total phenolic and flavonoid in horticultural products” | LINK

“A Rapid Method for Authentication of Macroalgae Based on Vis-NIR Spectroscopy Data Combined with Chemometrics Approach” LINK

“Polymers : Characterization and Prediction of Mechanical and Chemical Properties of Luanta Fir Wood with Vacuum Hydrothermal Treatment” LINK

“Develop NonDestructive Models to Predict Oil Content and Fatty Acid Composition in Gomenzer (Ethiopian Mustard) Using NearInfrared Reflectance Spectroscopy” LINK

“Combining portable NIR spectroscopy and multivariate calibration for the determination of ethanol in fermented alcoholic beverages by a multi-product model” LINK

“Modeling and optimization of malondialdehyde (MDA) absorbance behavior through response surface methodology (RSM) and artificial intelligence network (AIN): An endeavor to estimate lipid peroxidation by Determination of MDA” LINK

“Remote Sensing : Dynamic Maize Yield Predictions Using Machine Learning on Multi-Source Data” LINK

“Chemosensors : Extracting Information and Enhancing the Quality of Separation Data: A Review on Chemometrics-Assisted Analysis of Volatile, Soluble and Colloidal Samples” | LINK

“Improved Principal Component Analysis (IPCA): A Novel Method for Quantitative Calibration Transfer between Different Near-Infrared Spectrometers” | LINK

Research on Spectroscopy

“Polymers : Studying the Physical and Chemical Properties of Polydimethylsiloxane Matrix Reinforced by Nanostructured TiO2 Supported on Mesoporous Silica” | LINK

Process Control and NIR Sensors

“Aquaphotomics Monitoring of Lettuce Freshness during Cold Storage” | LINK

“Foods : Aquaphotomics Monitoring of Lettuce Freshness during Cold Storage” | LINK

Environment NIR-Spectroscopy Application

“Remote Sensing : The Impact of the Type and Spatial Resolution of a Source Image on the Effectiveness of Texture Analysis” LINK

“Remote Sensing : Quantifying Temperate Forest Diversity by Integrating GEDI LiDAR and Multi-Temporal Sentinel-2 Imagery” LINK

“Sensors : Design and Experiment of Online Detection System for Water Content of Fresh Tea Leaves after Harvesting Based on Near Infra-Red Spectroscopy” | LINK

“Remote Sensing : Informativeness of the Long-Term Average Spectral Characteristics of the Bare Soil Surface for the Detection of Soil Cover Degradation with the Neural Network Filtering of Remote Sensing Data” LINK

Agriculture NIR-Spectroscopy Usage

“Nondestructive discrimination of analogous density foreign matter inside soy protein meat semi-finished products based on transmission hyperspectral imaging” LINK

“Agronomy : Effect of Ustilago maydis on the Nutritive Value and Aerobic Deterioration of Maize Silage” | LINK

“Rootstock’s and Cover-Crops’ Influence on Grape: A NIR-Based ANN Classification Model” | LINK

“Rapid and nondestructive method for identification of molds growth time in wheat grains based on hyperspectral imaging technology and chemometrics” LINK

“Plants : Spectral Discrimination of Macronutrient Deficiencies in Greenhouse Grown Flue-Cured Tobacco” LINK

“Microplastics Have Rice Cultivar-dependent Impacts on Grain Yield and Quality, and Nitrogenous Gas Losses From Paddy, but Not on Soil Properties” | LINK

“Qualitative and quantitative analysis of the pile fermentation degree of Pu-erh tea” LINK

“Rootstock’s and Cover-Crops’ Influence on Grape: A NIR-Based ANN Classification Model” LINK

“Sextonia rubra (Mez.) van der Werff sawmills residues as a valuable resource for the production of larvicidal extracts against Ae. aegypti Linnaeus (Diptera: Culicidae)” | LINK

“Printing CrackFree Microporous Structures by Combining Additive Manufacturing with Colloidal Assembly” LINK

“Mitigating nitrate leaching in cropland by enhancing microbial nitrate transformation through the addition of liquid biogas slurry” | LINK

“LightGuided Dynamic Liquid Crystalline Elastomer Actuators enabled by Mussel Adhesive Protein Chemistry” LINK

“INFLUENCE OF INSECTICIDES FOR STORED GRAIN PROTECTION ON THE TECHNOLOGICAL PROPERTIES OF WINTER WHEAT” LINK

“Classification of Heavy Metal Contamination Risk in Typical Agricultural Soils by Visible and Near Infrared Reflectance Spectroscopy” LINK

Food & Feed Industry NIR Usage

“Foods : Non-Destructive Discrimination of Sunflower Seeds with Different Internal Mildew Grades by Fusion of Near-Infrared Diffuse Reflectance and Transmittance Spectra Combined with 1D-CNN” | LINK

“Foods : Micronization Effects on Structural, Functional, and Antioxidant Properties of Wheat Bran” | LINK

Beverage and Drink Industry NIR Usage

“Non-Invasive Digital Technologies to Assess Wine Quality Traits and Provenance through the Bottle” | LINK

Other

“Portable Diffuse Reflectance Spectroscopy of Potato Leaves for Pre-Symptomatic Detection of Late Blight Disease” LINK

“A novel wavelength interval selection based on split regularized regression for spectroscopic data” | LINK

“大腿動静脈送脱血時の遠位側灌流において 工夫を要した症例” LINK

“Results in Chemistry” LINK

“Decoupling Individual Optical Nanosensor Responses Using a Spin-Coated Hydrogel Platform” LINK

“Internal reflectance cell fluorescence measurement combined with multi-way analysis to detect fluorescence signatures of undiluted honeys and a fusion of …” LINK

“Effects of motor pacing on frontalhemodynamic responses during continuous upperlimb and wholebody movements” LINK

Spectroscopy and Chemometrics/Machine-Learning News Weekly #10, 2023

Get the Spectroscopy and Chemometrics News Weekly in real time on Twitter @ CalibModel and follow us.

NIR Calibration-Model Services

Protip: For NIR Spectroscopy Data Analysis use a Data Analytics Service that is NIR Domain related. qualitycontrol foodsafety spectroscopy LINK

Spectroscopy and Chemometrics News Weekly 9, 2023 | NIRS NIR Spectroscopy MachineLearning Spectrometer Spectrometric Analytical Chemistry Chemical Analysis Lab Labs Laboratories Laboratory Software IoT Sensors QA QC Testing Quality LINK

Spektroskopie und Chemometrie Neuigkeiten Wöchentlich 9, 2023 | NIRS NIR Spektroskopie MachineLearning Spektrometer IoT Sensor Nahinfrarot Chemie Analytik Analysengeräte Analysentechnik Analysemethode Nahinfrarotspektroskopie Laboranalyse LINK

Spettroscopia e Chemiometria Weekly News 9, 2023 | NIRS NIR Spettroscopia MachineLearning analisi chimica Spettrale Spettrometro Chem IoT Sensore Attrezzatura analitica Laboratorio analisi prova qualità Analysesystem QualityControl LINK

Near-Infrared Spectroscopy (NIRS)

“Foods : Feature Reduction for the Classification of Bruise Damage to Apple Fruit Using a Contactless FT-NIR Spectroscopy with Machine Learning” | LINK

“Perbedaan Nilai Near Infrared Spectroscopic terhadap Posisi Head Up 15o dan Head Up 30 O pada Pasien yang Dirawat di Ruang Intensive Care Unit” LINK

“Broad learning system with Takagi-Sugeno fuzzy subsystem for tobacco origin identification based on near infrared spectroscopy” LINK

“Rapid and Non-Invasive Detection of Aedes aegypti Co-Infected with Zika and Dengue Viruses Using Near Infrared Spectroscopy” LINK

“Multivariate Curve Resolution Applied to Near Infrared Spectroscopic Data Acquired Throughout the Cooking Process to Monitor Evolving Béchamel Sauces” | LINK

“Limited usefulness of visible-near-infrared spectroscopy in soils: The picture gets much clearer” LINK

“Application of Near Infrared Spectroscopy to Monitor the Quality Change of Sour Cherry Stored under Modified Atmosphere Conditions” LINK

“Assessment of integrated freshness index of different varieties of eggs using the visible and near-infrared spectroscopy” LINK

“Super Broadband Near‐Infrared Solid Solution Phosphors with Adjustable Peak Wavelengths from 1165 to 875 nm for NIR Spectroscopy Applications” LINK

“Determination of the ADF and IVOMD Content of Sugarcane Using Near Infrared Spectroscopy Coupled with Chemometrics” LINK

“Evaluating the Use of a Similarity Index (SI) Combined with near Infrared (NIR) Spectroscopy as Method in Meat Species Authenticity” | LINK

“Rapid Determination of Geniposide and Baicalin in Lanqin Oral Solution by Near-Infrared Spectroscopy with Chemometric Algorithms during Alcohol Precipitation” LINK

“Applied Sciences : Determination of Coniferous Wood’s Compressive Strength by SE-DenseNet Model Combined with Near-Infrared Spectroscopy” LINK

“Estimation of Proximate, Fatty Acid, Mineral Content and Proline Level in Amaranth using Near Infrared Reflectance Spectroscopy” LINK

“Non-invasive measurement of shear force in chicken meat using near infrared spectroscopy supported by neural network analysis” LINK

“Application of NIRS adaptive technology for prediction of in vitro digestibility parameters of feed ingredients from Fermented Cocoa Pods” LINK

“Visible-Near Infrared Reflectance Spectroscopy for Rhodamine B Detection in Chili Paste Using Principal Component Analysis” LINK

“Foods : Lipids in a Nutshell: Quick Determination of Lipid Content in Hazelnuts with NIR Spectroscopy” | LINK

“Near-infrared spectroscopy for early selection of waxy cassava clones via seed analysis” | LINK

“An Efficient Perovskite‐Like Phosphor with Peak Emission Wavelength at 850 nm for High‐Performance NIR LEDs” LINK

Infrared Spectroscopy (IR) and Near-Infrared Spectroscopy (NIR)

“Sensors : Towards a Miniaturized Photoacoustic Detector for the Infrared Spectroscopic Analysis of SO2F2 and Refrigerants” | LINK

“Correlating near infrared data for improved polyolefin recycling” LINK

“NON-DESTRUCTIVE ASSESSMENT OF SOIL ORGANIC CARBON USING NEAR INFRARED TECHNOLOGY” | Mechram.pdf LINK

“FullColor Emissive DDA Carbazole Luminophores: Red to NearInfrared Mechanofluorochromism, AggregationInduced NearInfrared Emission, and Photodynamic Therapy Application” LINK

Hyperspectral Imaging (HSI)

“Applied Sciences : Rapid Estimation of Moisture Content in Unpeeled Potato Tubers Using Hyperspectral Imaging” | LINK

“Remote Sensing : Applying Variable Selection Methods and Preprocessing Techniques to Hyperspectral Reflectance Data to Estimate Tea Cultivar Chlorophyll Content” LINK

Chemometrics and Machine Learning

“Remote Sensing : Maize Yield Prediction with Machine Learning, Spectral Variables and Irrigation Management” | LINK

“Improving the Performance of a Spectral Model to Estimate Total Nitrogen Content with Small Soil Samples Sizes” LINK

“Rapid quantification of goat milk adulteration with cow milk using Raman spectroscopy and chemometrics” LINK

“Determination of Diclofenac Diethylamine Levels in Emulgel Preparations Using NIR Spectroscopy Combined with Chemometrics” LINK

“Selection of reference samples for updating multivariate calibration models used in the analysis of pig faeces” LINK

“Chemosensors : How Chemometrics Revives the UV-Vis Spectroscopy Applications as an Analytical Sensor for Spectralprint (Nontargeted) Analysis” | LINK

“An integrated approach utilizing raman spectroscopy and chemometrics for authentication and detection of adulteration of agarwood essential oils” | LINK

“Miniaturized NIR spectroscopy and chemometrics: A smart combination to solve food authentication challenges” | LINK

“In Vitro Validation of a New Tissue Oximeter Using Visible Light” | LINK

Optics for Spectroscopy

“Investigation of PAN: Hemp Stems Nanofibers Produced by Electrospinning Method” LINK

Equipment for Spectroscopy

“FeDoped Carbon Dots as NIRII Fluorescence Probe for In Vivo Gastric Imaging and pH Detection” LINK

“Chemosensors : Wavelet Transform Makes Water an Outstanding Near-Infrared Spectroscopic Probe” | LINK

Environment NIR-Spectroscopy Application

“Comparison of soil salinity indices based on satellite imagery analysis in Syrdarya province, Uzbekistan” | LINK

“Colorants : Andy Warhol and His Amazing Technicolor Shoes: Characterizing the Synthetic Dyes Found in Dr. Ph. Martin’s Synchromatic Transparent Watercolors and Used in À la Recherche du Shoe Perdu” | LINK

Agriculture NIR-Spectroscopy Usage

“Variation in potential feeding value of triticale forage among plant fraction, maturity stage, growing season and genotype” LINK

“Effect of nps fertilizer and harvesting stage on biomass yield and quality parameters of bracharia grass under supplementary irrigation in Southern Ethiopia” LINK

“Analysis of Seasonal Effects on Nutritive Value of Native Forages in the Southern Great Plains and Its Relationship to Sampling Method” LINK

“Non-Destructive Evaluation of Moisture Content in Single Soybean Seed Using Vis-NIR Spectroscopy” LINK

“Rootstock’s and Cover-Crops’ Influence on Grape: A NIR-Based ANN Classification Model” LINK

“Classification of Heavy Metal Contamination Risk in Typical Agricultural Soils by Visible and Near Infrared Reflectance Spectroscopy” LINK

“Effect of Ustilago maydis on the Nutritive Value and Aerobic Deterioration of Maize Silage” | LINK

“IJMS : Label-Free Characterization of Macrophage Polarization Using Raman Spectroscopy” | LINK

Food & Feed Industry NIR Usage

“Animals : Licury Cake in Diets for Lactating Goats: Qualitative Aspects of Milk and Cheese” | LINK

“Wheat yield estimation using remote sensing data based on machine learning approaches” | LINK

Other

“Applications of High-Throughput Phenotypic Phenomics” | LINK

“Evaluation of dry matter content in intact potatoes using different optical sensing modes” | LINK

“Doped potassium dihydrogen phosphate single crystals with enhanced second-harmonic generation efficiency: An investigation of phase purity, nonlinear …” LINK

“Neurophysiological effects of ischaemia” LINK

“Development of Automatic Controlled Walking Assistive Device Based on Fatigue and Emotion Detection” LINK

“Assessing Neurovascular Coupling Using Wavelet Coherence in Neonates with Asphyxia” | LINK

“Intramuscular Circulation of the Lumbar Multifidus in Different Trunk Positions on Standing” | LINK

“The Intramuscular Circulation Is Affected by Neck and Shoulder Pain” | LINK

Spectroscopy and Chemometrics Machine-Learning News Weekly #1, 2023

Spectroscopy and Chemometrics/Machine-Learning News Weekly #1, 2023

NIR Calibration-Model Services

This week’s NIR news Weekly is sponsored by Your-Company-Name-Here – NIR-spectrometers. Check out their product page … link

Get the Spectroscopy and Chemometrics News Weekly in real time on Twitter @ CalibModel and follow us.

Spectroscopy and Chemometrics News Weekly 50, 2022 | NIRS NIR Spectroscopy MachineLearning Spectrometer Spectrometric Analytical Chemistry Chemical Analysis Lab Labs Laboratories Laboratory Software IoT Sensors QA QC Testing Quality LINK

Near-Infrared Spectroscopy (NIRS)

“Foods : Prediction Models for the Content of Calcium, Boron and Potassium in the Fruit of ‘Huangguan’ Pears Established by Using Near-Infrared Spectroscopy” LINK

” A high-throughput method for precise phenotyping sugarcane stalk mechanical strength using near-infrared spectroscopy” |) LINK

“Construction and Application of Detection Model for Leucine and Tyrosine Content in Golden Tartary Buckwheat Based on Near Infrared Spectroscopy” LINK

“Rapid recognition of different sources of methamphetamine drugs based on hand-held near infrared spectroscopy and multi-layer-extreme learning machine algorithms” LINK

“Rapid determination of viscosity and viscosity index of lube base oil based on near-infrared spectroscopy and new transformation formula” LINK

“Global Soil Salinity Prediction by Open Soil Vis-NIR Spectral Library” LINK

“Experimental Validation of the Dynamic Molecular State of Water in Damaged Polymer Composites Using Near Infrared Spectroscopy” LINK

“Gaussian process regression for prediction and confidence analysis of fruit traits by near-infrared spectroscopy” | LINK

“Research Article Rapid and Nondestructive Detection of Proline in Serum Using Near-Infrared Spectroscopy and Partial Least Squares” |) LINK

“Before reliable near infrared spectroscopic analysis-the critical sampling proviso. Part 1. Generalised theory of sampling” LINK

“Expeditious detection of Fusarium graminearum infection in rice by FTNIR using hierarchical cluster analysis” LINK

“Simple dilated convolutional neural network for quantitative modeling based on near infrared spectroscopy techniques” LINK

“Fast and nondestructive discrimination of fresh tea leaves at different altitudes based on near infrared spectroscopy and various chemometrics methods” LINK

“Near-infrared leaf reflectance modeling of Annona emarginata seedlings for early detection of variations in nitrogen concentration” LINK

“Luminescence properties and phase transformation of broadband NIR emitting A2 (WO4) 3: Cr3+ (A= Al3+, Sc3+) phosphors toward NIR spectroscopy applications” LINK

“NIR spectroscopy combined with 1D-convolutional neural network for breast cancerization analysis and diagnosis” LINK

“Associations between visceral adipose tissue estimates produced by near-infrared spectroscopy, mobile anthropometrics, and traditional body composition …” LINK

“Near-infrared spectroscopy method for rapid proximate quantitative analysis of nutrient composition in Pacific oyster Crassostrea gigas” LINK

“Codoping Ti in low Co-containing hibonite achieving excellent optical properties for near-infrared reflective pigment applications” LINK

“Rapid Discrimination of Eucalypt Species Using A Handheld near-Infrared Instrument” LINK

“Discrimination of Minced Mutton Adulteration Based on Sized-Adaptive Online NIRS Information and 2D Conventional Neural Network. Foods 2022, 11, 2977” LINK

“Predicting the dietary fiber content of fresh-cut bamboo shoots using a visible and near-infrared hyperspectral technique” LINK

“Fruit detection research based on near-infrared spectroscopy and lightweight neural network” LINK

“Use of Near-Infrared Spectroscopy to Discriminate DFD Beef and Predict Meat Quality Traits in Autochthonous Breeds” LINK

” A quick and precise online near-infrared spectroscopy assay for high-throughput screening biomass digestibility in large scale sugarcane germplasm” LINK

Infrared Spectroscopy (IR) and Near-Infrared Spectroscopy (NIR)

“Honey quality detection based on near-infrared spectroscopy” LINK

“Evaluation of the potential of near infrared hyperspectral imaging for monitoring the invasive brown marmorated stink bug” LINK

“Denoising stacked autoencodersbased nearinfrared quality monitoring method via robust samples evaluation” LINK

Hyperspectral Imaging (HSI)

“What Lies Beyond Sight? Applications of Ultraportable Hyperspectral Imaging (VIS-NIR) for Archaeological Fieldwork” LINK

“Visualization research of egg freshness based on hyperspectral imaging and binary competitive adaptive reweighted sampling” LINK

“From RGB camera to Hyperspectral imaging: a breakthrough in Neolithic Rock Painting analysis” LINK

Chemometrics and Machine Learning

“Agronomy : Low-Cost Electronic Nose for Wine Variety Identification through Machine Learning Algorithms” LINK

“PLS-DA” LINK

“Sensors : Land-Use and Land-Cover Classification in Semi-Arid Areas from Medium-Resolution Remote-Sensing Imagery: A Deep Learning Approach” LINK

“Chemosensors : Applying Two-Dimensional Correlation Spectroscopy and Principal Component Analysis to Understand How Temperature Affects the Neptunium(V) Absorption Spectrum” LINK

“Desert Soil Salinity Inversion Models Based on Field In Situ Spectroscopy in Southern Xinjiang, China” LINK

“Spatial prediction of soil properties through hybridized random forest model and combination of reflectance spectroscopy and environmental covariates” LINK

Optics for Spectroscopy

“Sensors : From Materials to Technique: A Complete Non-Invasive Investigation of a Group of Six Ukiyo-E Japanese Woodblock Prints of the Oriental Art Museum E. Chiossone (Genoa, Italy)” LINK

Research on Spectroscopy

“VESTNIK OF ASTRAKHAN STATE TECHNICAL UNIVERSITY. SERIES: FISHING INDUSTRY” LINK

“Novel broad spectral response perovskite solar cells: A review of the current status and advanced strategies for breaking the theoretical limit efficiency” LINK

Environment NIR-Spectroscopy Application

“Remote Sensing : Estimation of Potato Above-Ground Biomass Based on Vegetation Indices and Green-Edge Parameters Obtained from UAVs” LINK

Agriculture NIR-Spectroscopy Usage

“Application of multi-layer neural network and hyperspectral reflectance in genome-wide association study for grain yield in bread wheat” LINK

“The experience of vertigo: A systematic review of neuroimaging studies” LINK

“Microorganisms : Assessment of the Microbial Spoilage and Quality of Marinated Chicken Souvlaki through Spectroscopic and Biomimetic Sensors and Data Fusion” LINK

“Agronomy : Rice Leaf Chlorophyll Content Estimation Using UAV-Based Spectral Images in Different Regions” LINK

Food & Feed Industry NIR Usage

“Rapid Determination of Protein, Starch and Moisture Contents in Wheat Flour by Near-Infrared Hyperspectral” LINK

Chemical Industry NIR Usage

“Polymers : Physico-Mechanical, Thermal, Morphological, and Aging Characteristics of Green Hybrid Composites Prepared from Wool-Sisal and Wool-Palf with Natural Rubber” LINK

Other

“Chemosensors : Gold Nanostar-Based Sensitive Catechol Plasmonic Colorimetric Sensing Platform with Ultra-Wide Detection Range” LINK

“The Significance of Media Arts Education from a Cognitive Science Approach” LINK

“Minerals : Study on Spectral Characteristics and Color Origin of Scheelite from Xuebaoding, Pingwu County, Sichuan Province, P.R. China” LINK

“Prognostic value of syntax score, intravascular ultrasound and near-infrared spectroscopy to identify low-risk patients with coronary artery disease 5-year …” LINK

“深さ選択性近赤外光アルゴリズムによる表層信号の抑制効果の向上” LINK

Spectroscopy and Chemometrics News Weekly #17, 2021NIR-Spektroskopie und Chemometrie Neuigkeiten Wöchentlich #17, 2021NIRS-Spettroscopia e Chemiometria Weekly News #17, 2021

NIR Calibration-Model Services

Spectroscopy and Chemometrics News Weekly 16, 2021 | NIRS NIR Spectroscopy MachineLearning Spectrometer Spectrometric Analytical Chemistry Chemical Analysis Lab Labs Laboratories Laboratory Software IoT Sensors QA QC Testing Quality LINK

This week's NIR news Weekly is sponsored by Your-Company-Name-Here - NIR-spectrometers. Check out their product page ... link

Get the Spectroscopy and Chemometrics News Weekly in real time on Twitter @ CalibModel and follow us.


Near-Infrared Spectroscopy (NIRS)

"Enhanced quality monitoring during black tea processing by the fusion of NIRS and computer vision" LINK

"Solvent-Free Determination of TPH in Soil by Near-Infrared Reflectance Spectroscopy Solvent-Free Determination of TPH in Soil by Near-Infrared Reflectance ..." LINK

"A novel NIRS modelling method with OPLS-SPA and MIX-PLS for timber evaluation" LINK

" Integrated NIRS and QTL assays reveal minor mannose and galactose as contrast lignocellulose factors for biomass enzymatic saccharification in rice" LINK

"Visible-NIR Spectral Characterization and Grade Inversion Modelling Study of the Derni Copper Deposit" LINK

"A Hyphenated Approach Combining Pressure-Decay and In Situ FT-NIR Spectroscopy to Monitor Penetrant Sorption and Concurrent Swelling in Polymers" LINK

"Application of FT-NIR spectroscopy for evaluation of feeds digestibility by analysis of feces chemical composition" LINK

"Rapid and cost-effective nutrient content analysis of cotton leaves using near-infrared spectroscopy (NIRS)" | LINK

"TEKNOLOGI NIRS UNTUK KLASIFIKASI CAMPURAN MINYAK NILAM HASIL FRAKSINASI DENGAN MINYAK KERUING MENGGUNAKAN METODE PRINCIPAL ..." LINK

"Uso da espectroscopia de infravermelho próximo com Transformada de Fourier (FT-NIR) para acompanhar o processo de Tristeza Parasitária Bovina" LINK

"Transfer learning and wavelength selection method in NIR spectroscopy to predict glucose and lactate concentrations in culture media using VIP‐Boruta" LINK

"Handheld short-wavelength NIR spectroscopy for rapid determination of sugars and carbohydrate in fresh juice with Sampling Error Profile Analysis" LINK


Infrared Spectroscopy (IR) and Near-Infrared Spectroscopy (NIR)

"Intracranial Traumatic Hematoma Detection in Children Using a Portable Near-infrared Spectroscopy Device" LINK

" Convolutional Neural Networks for Quantitative Prediction of Different Organic Materials using Near-Infrared Spectrum" LINK

"Influences of bioplastic polylactic acid on near-infrared-based sorting of conventional plastic" LINK

"Multi-Way Analysis Coupled with Near-Infrared Spectroscopy in Food Industry: Models and Applications" LINK

" Can a smartphone near-infrared spectroscopy sensor predict days on feed and marbling score?" LINK

"Cross-laminated Timber Design by Flattened Bamboo based on Near-infrared Spectroscopy and Finite Element Analysis" LINK

"Applied Sciences, Vol. 11, Pages 2991: Radiation Effects on Pure-Silica Multimode Optical Fibers in the Visible and Near-Infrared Domains: Influence of OH Groups" LINK

"Selectivity and Sensitivity of Near-Infrared Spectroscopic Sensing of beta-Hydroxybutyrate, Glucose, and Urea in Ternary Aqueous Solutions" LINK

"Detection of fraud in lime juice using pattern recognition techniques and FTIR spectroscopy" LINK

"Estimation Method for Mass Transfer Coefficient Distribution using Near-Infrared Spectroscopy" LINK

"Discrimination of Infected Silkworm Chrysalises using Near-Infrared Spectroscopy Combined with Multivariate Analysis during the Cultivation of Cordyceps militaris" LINK

"Detecting melamineadulterated raw milk by using nearinfrared transmission spectroscopy" LINK

"Use of near-infrared spectroscopy for prediction of chemical composition of Tifton 85 grass" LINK

"Detection of Adulteration in Infant Formula Based on Ensemble Convolutional Neural Network and Near-Infrared Spectroscopy" LINK


Raman Spectroscopy

"Surface-Enhanced Raman scattering of methylene blue on titanium nitride nanoparticles synthesized by laser ablation in organic solvents" LINK


Hyperspectral Imaging (HSI)

"Fast Unmixing and Change Detection in Multitemporal Hyperspectral Data" LINK

" Forensic analysis of beverage stains using hyperspectral imaging" LINK

"A comprehensive review of hyperspectral data fusion with LiDAR and SAR data" LINK

"Near-infrared hyperspectral imaging (NIR-HSI) and normalized difference ..." LINK

"Soil monitoring for precision farming using hyperspectral remote sensing and soil sensors" LINK


Terahertz Spectroscopy

"Multivariate Analysis of the Composition of Pharmaceutical Products Based on Terahertz Time-Domain Spectroscopy" LINK


Chemometrics and Machine Learning

"Scalable Marginal Likelihood Estimation for Model Selection in Deep Learning. (arXiv:2104.04975v1 [stat.ML])" LINK

"Can Coupling Multiple Complementary Methods Improve the Spectroscopic Based Diagnosis of Gastrointestinal Illnesses? A Proof of Principle Ex Vivo Study Using Celiac Disease as the Model Illness" LINK

"Comparative study between Partial Least Squares and Rational function Ridge Regression models for the prediction of moisture content of woodchip samples using a ..." LINK

"Prediction of various soil properties for a national spatial dataset of Scottish soils based on four different chemometric approaches: A comparison of near infrared and mid-infrared spectroscopy" LINK

"An Open Source Low-Cost Device Coupled with an Adaptative Time-Lag Time-Series Linear Forecasting Modeling for Apple Trentino (Italy) Precision Irrigation" Sensors LINK

"Evaluation of aqua MODIS thermal emissive bands stability through radiative transfer modeling" LINK

"Spectroscopy and Photochemistry of Copper Nitrate Clusters" LINK


Optics for Spectroscopy

"... using a combination of reverse phase high-performance liquid chromatography coupled to diode-array detector (RP-HPLC-DAD) and near-infrared spectroscopy  ..." LINK


Research on Spectroscopy

"Efficient utilization of date palm waste for the bioethanol production through <em>Saccharomyces cerevisiae</em> strain" LINK


Process Control and NIR Sensors

"Printing and Laser Curing of Ag and Cu Paste-Prospects and Challenges in Additive Manufacturing" LINK

"Application of Spectrometric Technologies in the Monitoring and Control of Foods and Beverages" OpenAccess LINK


Environment NIR-Spectroscopy Application

"ME-Net: A Deep Convolutional Neural Network for Extracting Mangrove Using Sentinel-2A Data" RemoteSensing LINK

"Mapping soil organic carbon stock by hyperspectral and time-series multispectral remote sensing images in low-relief agricultural areas" LINK

"Effect of slurry used with soil conditioners and fertilizers on structural, non‐structural carbohydrate and lignin content" LINK

"Rapid Detection of Salmonella typhimurium in Drinking Water by a White Light Reflectance Spectroscopy Immunosensor" Sensors LINK

"Fusion of Three Optical Sensors for Nondestructive Detection of Water Content in Lettuce Canopies" LINK


Agriculture NIR-Spectroscopy Usage

"Discrimination of soils managed with different sources of fertilization and plant species in organic and conventional farming through near-infrared spectroscopy and chemometrics" LINK

"In-Line Technologies for the Analysis of Important Milk Parameters during the Milking Process: A Review. Agriculture 2021, 11, 239" LINK

" Food recognition improvement by using hyper-spectral imagery" LINK

"Zero-Gradient Constrained Optimization for Destriping of 3D Imaging Data" LINK

"Hyperspectral Imaging for Identification of an Invasive Plant Mikania micrantha Kunth" LINK

"OPTIMIZING NEAR INFRARED REFLECTANCE SPECTROSCOPY TO PREDICT NUTRITIONAL QUALITY IN CHICKPEA HAULMS FOR LIVESTOCK FEED" LINK

" Fast Determination of the Rubber Content in Taraxacum Kok-Saghyz Fresh Biomass Using Portable Near Infrared Spectroscopy and Pyrolysis-Gas ..." |) LINK

"Discrimination of soils managed with different sources of fertilization and plant species in organic and conventional farming through nearinfrared spectroscopy and chemometrics" LINK

"Application of near infrared spectroscopy for determination of relationship between crop year, maturity group, and location on carbohydrate composition in soybeans" LINK


Food & Feed Industry NIR Usage

"The quality and shelf life of biscuits with cryo‐ground proso millet and buckwheat by‐products" LINK

"Quantitative analysis of colony number in mouldy wheat based on near infrared spectroscopy combined with colorimetric sensor" LINK


Beverage and Drink Industry NIR Usage

"Clay coatings on sands in the western Qaidam Basin, Tibetan Plateau, China: Implications for the Martian clay detection" LINK


Laboratory and NIR-Spectroscopy

"The potential of handheld near infrared spectroscopy to detect food adulteration: Results of a global, multi-instrument inter-laboratory study" LINK


Other

"Influence of γ-ray exposure and dose dependent characteristics of (n) PbS-(p) Si hetero-structure" LINK

"Interval selection: A casestudybased approach" LINK

" The Relation Of İntraoperative Renal Oxygen Saturation Change With Postoperative Acute Kidney İnjury" LINK

"Acoustically‐Propelled Rodlike Liquid Metal Colloidal Motors" LINK

"Application of near" LINK

" Impact of Source to Substrate Distance on the Properties of Thermally Evaporated CdS Film" LINK

"Stability in solution and chemoprotection by octadecavanadates(IV/V) in E. coli cultures" LINK


.

NIR Calibration-Model Services

Spektroskopie und Chemometrie Neuigkeiten Wöchentlich 16, 2021 | NIRS NIR Spektroskopie MachineLearning Spektrometer IoT Sensor Nahinfrarot Chemie Analytik Analysengeräte Analysentechnik Analysemethode Nahinfrarotspektroskopie Laboranalyse LINK

This week's NIR news Weekly is sponsored by Your-Company-Name-Here - NIR-spectrometers. Check out their product page ... link

Get the Spectroscopy and Chemometrics News Weekly in real time on Twitter @ CalibModel and follow us.


Near-Infrared Spectroscopy (NIRS)

"Enhanced quality monitoring during black tea processing by the fusion of NIRS and computer vision" LINK

"Solvent-Free Determination of TPH in Soil by Near-Infrared Reflectance Spectroscopy Solvent-Free Determination of TPH in Soil by Near-Infrared Reflectance ..." LINK

"A novel NIRS modelling method with OPLS-SPA and MIX-PLS for timber evaluation" LINK

" Integrated NIRS and QTL assays reveal minor mannose and galactose as contrast lignocellulose factors for biomass enzymatic saccharification in rice" LINK

"Visible-NIR Spectral Characterization and Grade Inversion Modelling Study of the Derni Copper Deposit" LINK

"A Hyphenated Approach Combining Pressure-Decay and In Situ FT-NIR Spectroscopy to Monitor Penetrant Sorption and Concurrent Swelling in Polymers" LINK

"Application of FT-NIR spectroscopy for evaluation of feeds digestibility by analysis of feces chemical composition" LINK

"Rapid and cost-effective nutrient content analysis of cotton leaves using near-infrared spectroscopy (NIRS)" | LINK

"TEKNOLOGI NIRS UNTUK KLASIFIKASI CAMPURAN MINYAK NILAM HASIL FRAKSINASI DENGAN MINYAK KERUING MENGGUNAKAN METODE PRINCIPAL ..." LINK

"Uso da espectroscopia de infravermelho próximo com Transformada de Fourier (FT-NIR) para acompanhar o processo de Tristeza Parasitária Bovina" LINK

"Transfer learning and wavelength selection method in NIR spectroscopy to predict glucose and lactate concentrations in culture media using VIP‐Boruta" LINK

"Handheld short-wavelength NIR spectroscopy for rapid determination of sugars and carbohydrate in fresh juice with Sampling Error Profile Analysis" LINK


Infrared Spectroscopy (IR) and Near-Infrared Spectroscopy (NIR)

"Intracranial Traumatic Hematoma Detection in Children Using a Portable Near-infrared Spectroscopy Device" LINK

" Convolutional Neural Networks for Quantitative Prediction of Different Organic Materials using Near-Infrared Spectrum" LINK

"Influences of bioplastic polylactic acid on near-infrared-based sorting of conventional plastic" LINK

"Multi-Way Analysis Coupled with Near-Infrared Spectroscopy in Food Industry: Models and Applications" LINK

" Can a smartphone near-infrared spectroscopy sensor predict days on feed and marbling score?" LINK

"Cross-laminated Timber Design by Flattened Bamboo based on Near-infrared Spectroscopy and Finite Element Analysis" LINK

"Applied Sciences, Vol. 11, Pages 2991: Radiation Effects on Pure-Silica Multimode Optical Fibers in the Visible and Near-Infrared Domains: Influence of OH Groups" LINK

"Selectivity and Sensitivity of Near-Infrared Spectroscopic Sensing of beta-Hydroxybutyrate, Glucose, and Urea in Ternary Aqueous Solutions" LINK

"Detection of fraud in lime juice using pattern recognition techniques and FTIR spectroscopy" LINK

"Estimation Method for Mass Transfer Coefficient Distribution using Near-Infrared Spectroscopy" LINK

"Discrimination of Infected Silkworm Chrysalises using Near-Infrared Spectroscopy Combined with Multivariate Analysis during the Cultivation of Cordyceps militaris" LINK

"Detecting melamineadulterated raw milk by using nearinfrared transmission spectroscopy" LINK

"Use of near-infrared spectroscopy for prediction of chemical composition of Tifton 85 grass" LINK

"Detection of Adulteration in Infant Formula Based on Ensemble Convolutional Neural Network and Near-Infrared Spectroscopy" LINK


Raman Spectroscopy

"Surface-Enhanced Raman scattering of methylene blue on titanium nitride nanoparticles synthesized by laser ablation in organic solvents" LINK


Hyperspectral Imaging (HSI)

"Fast Unmixing and Change Detection in Multitemporal Hyperspectral Data" LINK

" Forensic analysis of beverage stains using hyperspectral imaging" LINK

"A comprehensive review of hyperspectral data fusion with LiDAR and SAR data" LINK

"Near-infrared hyperspectral imaging (NIR-HSI) and normalized difference ..." LINK

"Soil monitoring for precision farming using hyperspectral remote sensing and soil sensors" LINK


Terahertz Spectroscopy

"Multivariate Analysis of the Composition of Pharmaceutical Products Based on Terahertz Time-Domain Spectroscopy" LINK


Chemometrics and Machine Learning

"Scalable Marginal Likelihood Estimation for Model Selection in Deep Learning. (arXiv:2104.04975v1 [stat.ML])" LINK

"Can Coupling Multiple Complementary Methods Improve the Spectroscopic Based Diagnosis of Gastrointestinal Illnesses? A Proof of Principle Ex Vivo Study Using Celiac Disease as the Model Illness" LINK

"Comparative study between Partial Least Squares and Rational function Ridge Regression models for the prediction of moisture content of woodchip samples using a ..." LINK

"Prediction of various soil properties for a national spatial dataset of Scottish soils based on four different chemometric approaches: A comparison of near infrared and mid-infrared spectroscopy" LINK

"An Open Source Low-Cost Device Coupled with an Adaptative Time-Lag Time-Series Linear Forecasting Modeling for Apple Trentino (Italy) Precision Irrigation" Sensors LINK

"Evaluation of aqua MODIS thermal emissive bands stability through radiative transfer modeling" LINK

"Spectroscopy and Photochemistry of Copper Nitrate Clusters" LINK


Optics for Spectroscopy

"... using a combination of reverse phase high-performance liquid chromatography coupled to diode-array detector (RP-HPLC-DAD) and near-infrared spectroscopy  ..." LINK


Research on Spectroscopy

"Efficient utilization of date palm waste for the bioethanol production through <em>Saccharomyces cerevisiae</em> strain" LINK


Process Control and NIR Sensors

"Printing and Laser Curing of Ag and Cu Paste-Prospects and Challenges in Additive Manufacturing" LINK

"Application of Spectrometric Technologies in the Monitoring and Control of Foods and Beverages" OpenAccess LINK


Environment NIR-Spectroscopy Application

"ME-Net: A Deep Convolutional Neural Network for Extracting Mangrove Using Sentinel-2A Data" RemoteSensing LINK

"Mapping soil organic carbon stock by hyperspectral and time-series multispectral remote sensing images in low-relief agricultural areas" LINK

"Effect of slurry used with soil conditioners and fertilizers on structural, non‐structural carbohydrate and lignin content" LINK

"Rapid Detection of Salmonella typhimurium in Drinking Water by a White Light Reflectance Spectroscopy Immunosensor" Sensors LINK

"Fusion of Three Optical Sensors for Nondestructive Detection of Water Content in Lettuce Canopies" LINK


Agriculture NIR-Spectroscopy Usage

"Discrimination of soils managed with different sources of fertilization and plant species in organic and conventional farming through near-infrared spectroscopy and chemometrics" LINK

"In-Line Technologies for the Analysis of Important Milk Parameters during the Milking Process: A Review. Agriculture 2021, 11, 239" LINK

" Food recognition improvement by using hyper-spectral imagery" LINK

"Zero-Gradient Constrained Optimization for Destriping of 3D Imaging Data" LINK

"Hyperspectral Imaging for Identification of an Invasive Plant Mikania micrantha Kunth" LINK

"OPTIMIZING NEAR INFRARED REFLECTANCE SPECTROSCOPY TO PREDICT NUTRITIONAL QUALITY IN CHICKPEA HAULMS FOR LIVESTOCK FEED" LINK

" Fast Determination of the Rubber Content in Taraxacum Kok-Saghyz Fresh Biomass Using Portable Near Infrared Spectroscopy and Pyrolysis-Gas ..." |) LINK

"Discrimination of soils managed with different sources of fertilization and plant species in organic and conventional farming through nearinfrared spectroscopy and chemometrics" LINK

"Application of near infrared spectroscopy for determination of relationship between crop year, maturity group, and location on carbohydrate composition in soybeans" LINK


Food & Feed Industry NIR Usage

"The quality and shelf life of biscuits with cryo‐ground proso millet and buckwheat by‐products" LINK

"Quantitative analysis of colony number in mouldy wheat based on near infrared spectroscopy combined with colorimetric sensor" LINK


Beverage and Drink Industry NIR Usage

"Clay coatings on sands in the western Qaidam Basin, Tibetan Plateau, China: Implications for the Martian clay detection" LINK


Laboratory and NIR-Spectroscopy

"The potential of handheld near infrared spectroscopy to detect food adulteration: Results of a global, multi-instrument inter-laboratory study" LINK


Other

"Influence of γ-ray exposure and dose dependent characteristics of (n) PbS-(p) Si hetero-structure" LINK

"Interval selection: A casestudybased approach" LINK

" The Relation Of İntraoperative Renal Oxygen Saturation Change With Postoperative Acute Kidney İnjury" LINK

"Acoustically‐Propelled Rodlike Liquid Metal Colloidal Motors" LINK

"Application of near" LINK

" Impact of Source to Substrate Distance on the Properties of Thermally Evaporated CdS Film" LINK

"Stability in solution and chemoprotection by octadecavanadates(IV/V) in E. coli cultures" LINK


.
NIR Calibration-Model Services

Spettroscopia e Chemiometria Weekly News 16, 2021 | NIRS NIR Spettroscopia MachineLearning analisi chimica Spettrale Spettrometro Chem IoT Sensore Attrezzatura analitica Laboratorio analisi prova qualità Analysesystem QualityControl LINK

This week's NIR news Weekly is sponsored by Your-Company-Name-Here - NIR-spectrometers. Check out their product page ... link

Get the Spectroscopy and Chemometrics News Weekly in real time on Twitter @ CalibModel and follow us.


Near-Infrared Spectroscopy (NIRS)

"Enhanced quality monitoring during black tea processing by the fusion of NIRS and computer vision" LINK

"Solvent-Free Determination of TPH in Soil by Near-Infrared Reflectance Spectroscopy Solvent-Free Determination of TPH in Soil by Near-Infrared Reflectance ..." LINK

"A novel NIRS modelling method with OPLS-SPA and MIX-PLS for timber evaluation" LINK

" Integrated NIRS and QTL assays reveal minor mannose and galactose as contrast lignocellulose factors for biomass enzymatic saccharification in rice" LINK

"Visible-NIR Spectral Characterization and Grade Inversion Modelling Study of the Derni Copper Deposit" LINK

"A Hyphenated Approach Combining Pressure-Decay and In Situ FT-NIR Spectroscopy to Monitor Penetrant Sorption and Concurrent Swelling in Polymers" LINK

"Application of FT-NIR spectroscopy for evaluation of feeds digestibility by analysis of feces chemical composition" LINK

"Rapid and cost-effective nutrient content analysis of cotton leaves using near-infrared spectroscopy (NIRS)" | LINK

"TEKNOLOGI NIRS UNTUK KLASIFIKASI CAMPURAN MINYAK NILAM HASIL FRAKSINASI DENGAN MINYAK KERUING MENGGUNAKAN METODE PRINCIPAL ..." LINK

"Uso da espectroscopia de infravermelho próximo com Transformada de Fourier (FT-NIR) para acompanhar o processo de Tristeza Parasitária Bovina" LINK

"Transfer learning and wavelength selection method in NIR spectroscopy to predict glucose and lactate concentrations in culture media using VIP‐Boruta" LINK

"Handheld short-wavelength NIR spectroscopy for rapid determination of sugars and carbohydrate in fresh juice with Sampling Error Profile Analysis" LINK


Infrared Spectroscopy (IR) and Near-Infrared Spectroscopy (NIR)

"Intracranial Traumatic Hematoma Detection in Children Using a Portable Near-infrared Spectroscopy Device" LINK

" Convolutional Neural Networks for Quantitative Prediction of Different Organic Materials using Near-Infrared Spectrum" LINK

"Influences of bioplastic polylactic acid on near-infrared-based sorting of conventional plastic" LINK

"Multi-Way Analysis Coupled with Near-Infrared Spectroscopy in Food Industry: Models and Applications" LINK

" Can a smartphone near-infrared spectroscopy sensor predict days on feed and marbling score?" LINK

"Cross-laminated Timber Design by Flattened Bamboo based on Near-infrared Spectroscopy and Finite Element Analysis" LINK

"Applied Sciences, Vol. 11, Pages 2991: Radiation Effects on Pure-Silica Multimode Optical Fibers in the Visible and Near-Infrared Domains: Influence of OH Groups" LINK

"Selectivity and Sensitivity of Near-Infrared Spectroscopic Sensing of beta-Hydroxybutyrate, Glucose, and Urea in Ternary Aqueous Solutions" LINK

"Detection of fraud in lime juice using pattern recognition techniques and FTIR spectroscopy" LINK

"Estimation Method for Mass Transfer Coefficient Distribution using Near-Infrared Spectroscopy" LINK

"Discrimination of Infected Silkworm Chrysalises using Near-Infrared Spectroscopy Combined with Multivariate Analysis during the Cultivation of Cordyceps militaris" LINK

"Detecting melamineadulterated raw milk by using nearinfrared transmission spectroscopy" LINK

"Use of near-infrared spectroscopy for prediction of chemical composition of Tifton 85 grass" LINK

"Detection of Adulteration in Infant Formula Based on Ensemble Convolutional Neural Network and Near-Infrared Spectroscopy" LINK


Raman Spectroscopy

"Surface-Enhanced Raman scattering of methylene blue on titanium nitride nanoparticles synthesized by laser ablation in organic solvents" LINK


Hyperspectral Imaging (HSI)

"Fast Unmixing and Change Detection in Multitemporal Hyperspectral Data" LINK

" Forensic analysis of beverage stains using hyperspectral imaging" LINK

"A comprehensive review of hyperspectral data fusion with LiDAR and SAR data" LINK

"Near-infrared hyperspectral imaging (NIR-HSI) and normalized difference ..." LINK

"Soil monitoring for precision farming using hyperspectral remote sensing and soil sensors" LINK


Terahertz Spectroscopy

"Multivariate Analysis of the Composition of Pharmaceutical Products Based on Terahertz Time-Domain Spectroscopy" LINK


Chemometrics and Machine Learning

"Scalable Marginal Likelihood Estimation for Model Selection in Deep Learning. (arXiv:2104.04975v1 [stat.ML])" LINK

"Can Coupling Multiple Complementary Methods Improve the Spectroscopic Based Diagnosis of Gastrointestinal Illnesses? A Proof of Principle Ex Vivo Study Using Celiac Disease as the Model Illness" LINK

"Comparative study between Partial Least Squares and Rational function Ridge Regression models for the prediction of moisture content of woodchip samples using a ..." LINK

"Prediction of various soil properties for a national spatial dataset of Scottish soils based on four different chemometric approaches: A comparison of near infrared and mid-infrared spectroscopy" LINK

"An Open Source Low-Cost Device Coupled with an Adaptative Time-Lag Time-Series Linear Forecasting Modeling for Apple Trentino (Italy) Precision Irrigation" Sensors LINK

"Evaluation of aqua MODIS thermal emissive bands stability through radiative transfer modeling" LINK

"Spectroscopy and Photochemistry of Copper Nitrate Clusters" LINK


Optics for Spectroscopy

"... using a combination of reverse phase high-performance liquid chromatography coupled to diode-array detector (RP-HPLC-DAD) and near-infrared spectroscopy  ..." LINK


Research on Spectroscopy

"Efficient utilization of date palm waste for the bioethanol production through <em>Saccharomyces cerevisiae</em> strain" LINK


Process Control and NIR Sensors

"Printing and Laser Curing of Ag and Cu Paste-Prospects and Challenges in Additive Manufacturing" LINK

"Application of Spectrometric Technologies in the Monitoring and Control of Foods and Beverages" OpenAccess LINK


Environment NIR-Spectroscopy Application

"ME-Net: A Deep Convolutional Neural Network for Extracting Mangrove Using Sentinel-2A Data" RemoteSensing LINK

"Mapping soil organic carbon stock by hyperspectral and time-series multispectral remote sensing images in low-relief agricultural areas" LINK

"Effect of slurry used with soil conditioners and fertilizers on structural, non‐structural carbohydrate and lignin content" LINK

"Rapid Detection of Salmonella typhimurium in Drinking Water by a White Light Reflectance Spectroscopy Immunosensor" Sensors LINK

"Fusion of Three Optical Sensors for Nondestructive Detection of Water Content in Lettuce Canopies" LINK


Agriculture NIR-Spectroscopy Usage

"Discrimination of soils managed with different sources of fertilization and plant species in organic and conventional farming through near-infrared spectroscopy and chemometrics" LINK

"In-Line Technologies for the Analysis of Important Milk Parameters during the Milking Process: A Review. Agriculture 2021, 11, 239" LINK

" Food recognition improvement by using hyper-spectral imagery" LINK

"Zero-Gradient Constrained Optimization for Destriping of 3D Imaging Data" LINK

"Hyperspectral Imaging for Identification of an Invasive Plant Mikania micrantha Kunth" LINK

"OPTIMIZING NEAR INFRARED REFLECTANCE SPECTROSCOPY TO PREDICT NUTRITIONAL QUALITY IN CHICKPEA HAULMS FOR LIVESTOCK FEED" LINK

" Fast Determination of the Rubber Content in Taraxacum Kok-Saghyz Fresh Biomass Using Portable Near Infrared Spectroscopy and Pyrolysis-Gas ..." |) LINK

"Discrimination of soils managed with different sources of fertilization and plant species in organic and conventional farming through nearinfrared spectroscopy and chemometrics" LINK

"Application of near infrared spectroscopy for determination of relationship between crop year, maturity group, and location on carbohydrate composition in soybeans" LINK


Food & Feed Industry NIR Usage

"The quality and shelf life of biscuits with cryo‐ground proso millet and buckwheat by‐products" LINK

"Quantitative analysis of colony number in mouldy wheat based on near infrared spectroscopy combined with colorimetric sensor" LINK


Beverage and Drink Industry NIR Usage

"Clay coatings on sands in the western Qaidam Basin, Tibetan Plateau, China: Implications for the Martian clay detection" LINK


Laboratory and NIR-Spectroscopy

"The potential of handheld near infrared spectroscopy to detect food adulteration: Results of a global, multi-instrument inter-laboratory study" LINK


Other

"Influence of γ-ray exposure and dose dependent characteristics of (n) PbS-(p) Si hetero-structure" LINK

"Interval selection: A casestudybased approach" LINK

" The Relation Of İntraoperative Renal Oxygen Saturation Change With Postoperative Acute Kidney İnjury" LINK

"Acoustically‐Propelled Rodlike Liquid Metal Colloidal Motors" LINK

"Application of near" LINK

" Impact of Source to Substrate Distance on the Properties of Thermally Evaporated CdS Film" LINK

"Stability in solution and chemoprotection by octadecavanadates(IV/V) in E. coli cultures" LINK


.
NIR-Predictor – Manual


NIR-Predictor – Manual

Predicting Spectra

It’s easy to use with NIR-Predictor,
just drag & drop your data for getting the prediction results.

It supports an automatic file format detection.
So you don’t need to specify the instrument type and settings! See the list of supported formats and NIR Vendors: NIR-Predictor supported Spectral Data File Formats

Use the included data to checkout how it feels:

  1. Open the demo Spectra folder by using the Menu > Open Demo Spectra or press F8.
    There are files with spectra from different Vendors.
  2. Drag & drop a spectra file onto the NIR-Predictor window (or press Ctrl+O as for ’Open some files).
  3. The spectra will be
    • loaded
    • pre-processed
    • predicted and
    • reported

Note:
All the steps are fully automatic.
All calibrations that are compatible with the spectra, will produce prediction results in one go.
To select specific calibrations choose the Application. Where the ” ” empty means use all the calibrations.
To define a Application read more in chapter “Applications”

Hint:
To get access to Statistics of Predictions and Reports use the Menu > Show more/less (Ctrl+M) or you can simply resize the window. Here you can also re-do the Analyze step manually with changed inputs (e.g. Result Ordering).


Creating your own Calibrations

How it works – step by step

  1. You have measured your samples with you NIR-Instrument Software.
    And got the Lab-values of these samples.

    samples
    -> measured NIR-spectra
    -> Lab-references analytics

  2. Now you need to combine these data.

    NIR-spectra + Lab-references
    -> PropertiesBySamples

    Note: If you combined these data already in your NIR software used,
    and you can export it as a JCAMP-DX file then use
    Menu > Create Request File .req ... (F2)
    and read the “Help.html” and NIR-Predictor JCAMP.
    Else proceed as below.

    The NIR-Predictor provides tooling for that:

    Menu > Create Properties File... (F6)

    Select the folder with your NIR spectra measured for an application.
    NIR-Predictor creates a customized Properties file template for that data to enter the Lab values.

    Note: You don’t need to specify your instrument or vendor or an application. It’s all done automatically. And also the sample spectra are detected and grouped automatically!

  3. Use your favorite editor or spreadsheet program to enter and copy&paste
    the Lab-references Values into the columns “Prop1”, “Prop2” etc. and save the file.
  4. A final check of your entered data is done by NIR-Predictor,
    to make sure your data ist complete and all is fine.

    Menu > Create Calibration Request... (F7)

    Select the folder with the filled file.
    A CalibrationRequest.zip is created with the necessary data
    if enougth diverse Lab values are entered.

  5. Email the CalibrationRequest.zip file
    to info@CalibrationModel.com to develop the calibrations.
  6. When your calibrations are ready, you will receive an email with a link
    to the CalibrationModel WebShop where
    you can purchase and download the calibration files,
    that work with our free NIR-Predictor software without internet access.

    Note: Your sent NIR data is deleted after processing.
    We do not collect your NIR data!

Note: Further details can be found under “Create Properties File” and “Create Calibration Request”.


Configure the Calibrations for prediction usage

Configuration:

  1. in NIR-Predictor : Menu > Open Calibrations (F9)
  2. an explorer window is opened where the calibrations are located
  3. create a folder for your application, choose a name
  4. copy the calibration file(s) (*.cm) into that folder
  5. in NIR-Predictor : Menu > Search and load Applications (F4)

Usage:

  1. in NIR-Predictor : open the Application drop down list, and select your application by name
  2. if all is fine, the calibration file is valid and not expired, it shows : Calibration “1 valid calibation”
  3. the NIR-Predictor is now ready to predict
  4. to switch the application, goto 6.

Applications

The Application concept allows to group multiple Calibrations together for an Application. By selecting an Application before prediction, only the Calibrations belonging to the Application will be used for Prediction. In the Demo Data this is used to have multiple spectrometer as Application. This can be used easily as e.g. as Application “Meat Products” containing Fat and Moisture Calibration.

To create an Application, create a folder with the Application’s name inside the Calibrations folder, and move/copy all the Calibrations files to this Application folder. To remove a Calibration from the Application, remove the Calibration file from the Application folder.

After creating an new Application folder, press menu Search and load Applications (F4) to update the NIR-Predictor dialog where the Application can be selected via the dropdown list. You don’t need to close the NIR-Predictor.

After moving Calibration files around, press menu Search and load Calibrations (F5) to update the NIR-Predictor dialog.

The use-all case

In the NIR-Predictor dialog where the Application can be selected via the dropdown list, the empty "" name means that all (yes all) valid Calibrations will be used for prediction.

Note: The Prediction Report will contain only results from spectral compatible Calibrations with the given spectra. That allows to automatically handle the multi vendor NIR instrument usage.


Prediction Result Report

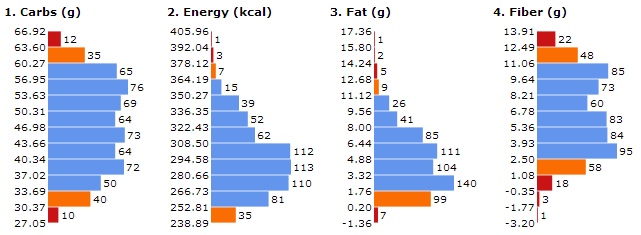
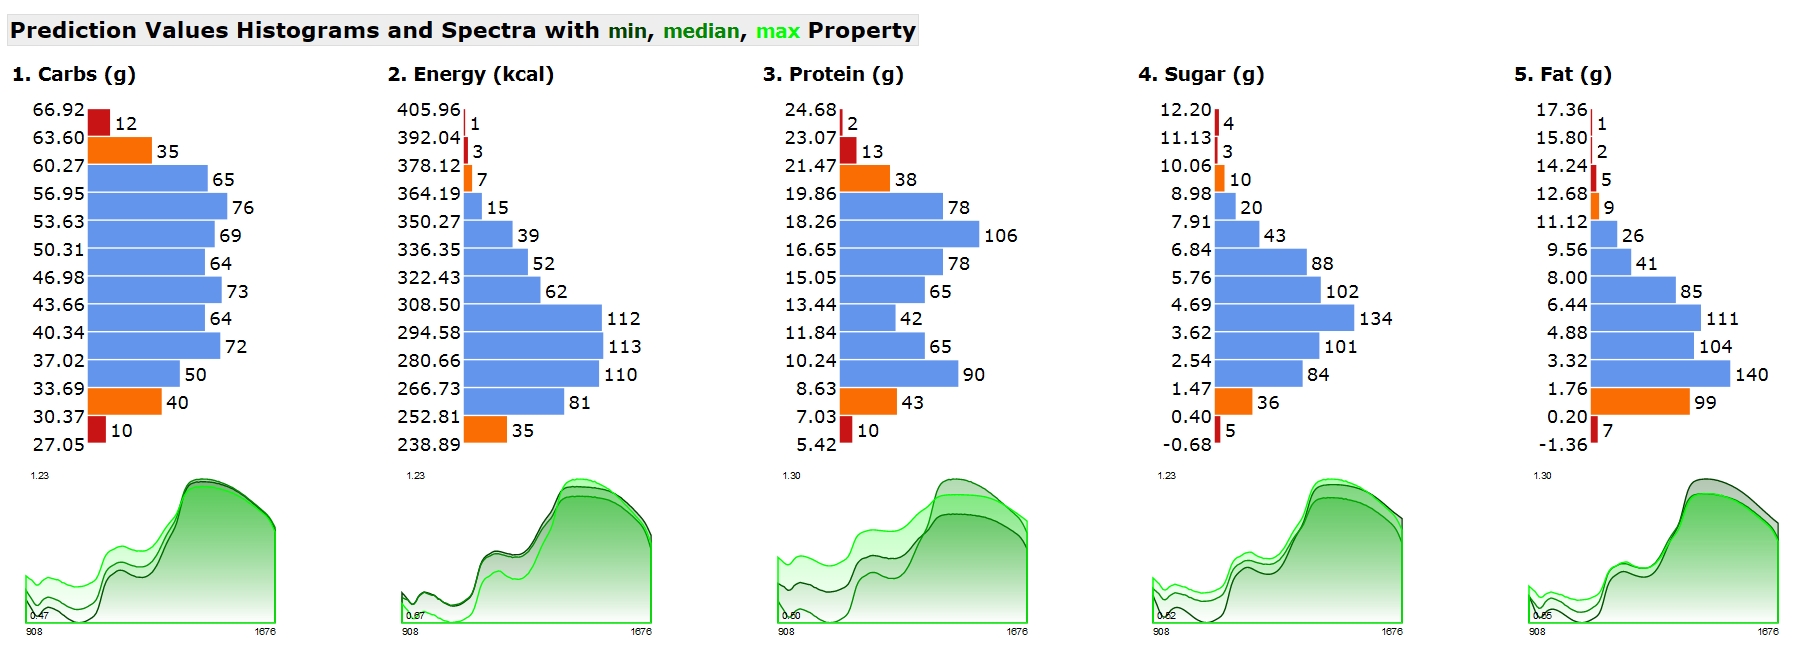
Histograms of Prediction Values per Property

Shows the distribution of the predicted results per calibration. The histogram range contains the range of the calibrated property and includes the predicted results.

The histogram bar (bin) color is defined as follow:

  • blue : all predictions inside calibration range.
  • red : all predictions outside calibration range.
  • orange : some overlaps with calibration range.
    So not all spectra in a orange bin are outside calibration range.
Histograms

Note: Predicted values are always shown in Histogram table and Prediction Value List table, even if the spectrum does not fit into model (spectrum different to model, aka Residual Outlier) shown as Out = X.

Note: Old browsers like Microsoft Internet Explorer 11 don’t support the grafics for Histogram charts. Use an current browser like Firefox or Chrome or Edge.

Note: If your browser opens the report too slow, try to deactivate some browser plugins, because they can filter what you look at and some add-ons are really slow.

Spectra Plot Thumbnail on the Prediction Report

Visualizes the min,median,max spectrum of the spectra dropped as files on the NIR-Predictor. This gives a minimal and good spectral overview of the predicted property results.

  • Spectra Plot color legend: min,median,max spectrum by predicted property or if no calibration is available by spectral intensity.
  • The min,median,max is determined from the predicted properties or if not available from the intensity of the spectra.
  • Beside the histogram of the predicted properties, where the distribution can be seen, the spectra shown are the ones from min,median,max predicted property.
  • This gives a minimal and good spectral overview of the predicted property results.
  • The “Spectral Range” and number of datapoints is shown in the Prediction Report Header below the listed spectra files.
  • To zoom the spectra plot a little, zoom the report in the browser (hold ctrl + mouse wheel, or pinch on touch screen).
  • The spectra plots and histograms are stored with the report and can be archived.

Note

  • Note that the spectra are shown in the raw values that are loaded, they are not shown pre-processed as the calibration model uses them to make the prediction.
  • Note that the median property spectrum is the median from the predicted property pobulation and not the “median” of the calibration property range.
  • Note that in the multi calibration prediction case, the spectra are selected for each property based on the related predicted property values and so the spectra plots shows typical different spectra.
Spectra Plot

Outlier Detection

To safeguard the prediction results, outliers are automatically checked for each individual prediction. This is based on limits that are determined when creating the calibration with the base data. Thus, a strange spectral measurement can be detected and signaled as an outlier even without base data only by means of the calibration and the NIR predictor. A prediction result with outlier warning is to be distrusted. How the various outlier tests are interpreted and how to avoid them in practice is described here.

The spectrum is an outlier to the model, if the spectrum is not similar with the spectra and lab-values the model is built with.

This legend is shown on each NIR-Predictor prediction report below the results:

Outlier (Out) Symbol Description

  • “X” : spectrum does not fit into model (spectrum different to model)
  • “O” : spectrum is wide outside model center (spectrum similar to model but far away)
  • “=” : prediction is outside upper or lower range of model (property outside model range)
  • “-” : spectrum is incompatible to calibration

Note: A prediction result with outlier warning is to be distrusted.

There are 3 outlier cases (X, O, =) and the incompatible data case “-”.

  • The bad case is “X”
  • the medium case is “O”
  • and the soft case is “=”.

The technical names in literature correspond to:

  • “X” : Spectral Residual Outlier
  • “O” : Leverage Outlier
  • “=” : Property Range Outlier

These 3 outlier cases can appear in combinations, like “XO=” or “XO” or “O=” or “X=”. The more outlier marker are shown the more likely the spectrum is an Outlier.

The default setting in NIR-Predictor Menu > “Report with Simplified Outlier Symbols”

  • is ON, that will show only the worst case instead of all combinations to have a simplified minimal information.
  • if OFF, that will show the combinations (e.g. “XO=” or “XO” or “O=” or “X=”), which is more informative for analyzing problem cases.

Some hints to avoid these Outliers:

  • “X” : spectrum does not fit into model (spectrum different to model)
    Check if the spectrum is noise only, or has no proper signal. That can happen when measured past the sample or measured into the air or at a different substance. If you have multiple NIR instruments of the same type, use spectra measured with different instruments for the calibration.
  • “O” : spectrum is wide outside model center (spectrum similar to model but far away) Sample temperature has an effect on NIR spectra shape, use spectra measured at different (typical use) temperatures (sample temperature, instrument temperature).
  • “=” : prediction is outside upper or lower range of model (property outside model range)
    Use more spectra for the calibration in the Lab value region where your special interest is. If the predicted value is only a little bit out of the calibration range, it can be Ok. Add these spectra to the calibration spectra (with the Lab values), to extend the prediction range of the calibration.
  • “-” : spectrum is incompatible to calibration
    The spectra (from the NIR instrument) has a different wavelength range or a different resolution than the spectra used for calibration. Check Instrument settings (wavelength range, resolution)

Result Ordering

To change the ordering, a drop-down-box is located below the Analyze button. If there is an analysis from the current session, and the Result Ordering is changed, the data is re-Analyzed and reported with the new Result Ordering setting. That allows to compare the different orderings. The Result Ordering is listed in the Prediction Report above the Prediction Value List and stored in the settings.

The order/sorting of the prediction results of the spectra can be defined:

  • GivenOrder (default) the given order of the spectra from file select dialog or drag&drop

*) sorted : ascending sort

  • Date_Name sorted by Date (if any) and then by Name
  • Name_Date sorted by Name and then by Date
  • Date_NamesWithNumbers sorted by Date (if any) and then by Name with number logic
  • NamesWithNumbers_Date sorted by Name with number logic (e.g. “ABC1” is before “ABC002” ) and then by Date

*) as above but sorted Rev : reverse sort = descending sort

  • Rev_Date_Name
  • Rev_Name_Date
  • Rev_Date_NamesWithNumbers
  • Rev_NamesWithNumbers_Date

E.g. with reverse sort by Rev_Date_Name, the newest spectra appear on top.

Depending on how many calibrations are used the result table is getting broader. To print the report (e.g. to Adobe PDF, FreePDF or Microsoft XPS), sometimes the landscape format is shorter in number of pages or in portrait a scale of 80% fits nicely. Or try another internet browser (Mozilla Firefox, Google Chrome, Microsoft Edge, …) to print the report and set the browser as your default browser so it will be opened by default.

Archiving Reports

Each report is contained in one file only, including the grafics. To save storage space the report file folder can be compressed to a zip file (.zip, .7z).


Enter lab values to NIR spectra

Entering the laboratory reference values for NIR calibrations

We have developed specialized tools into NIR-Predictor to combine the NIR and Lab data is a sample-based safe manner.

The main target is to improve Data Quality during the step of combining of the Lab data and the NIR data, because to model a good reliable calibration the data that build the base needs to be of high quality.

It also simplifies to enter the lab values manually to the corresponding NIR data, because of automatically grouping repeated NIR measurements of the same sample, so the lab values can be entered sample based and not by spectrum.

It helps to avoid false reference data, because of the broken relation of NIR spectra and reference values, data entry on the wrong position in the table.

And Helps to detect errors of duplicated or multiple copies of spectra files, and checks for inconsistencies in Date-Time and Sample-Naming. It also checks for missing values.

That all increases the Data Quality for the next step of Calibration Development, and makes data entry a less time consuming and less risky work.

How it works

  1. Menu > Create Properties File... (F6) select the folder with your NIR spectra measured for an application. NIR-Predictor creates a Properties file template for that data : PropertiesBySamples.csv.txt
  2. Use your favorite editor or spreadsheet program to enter and copy&paste the Lab Values into the columns and save the file.
  3. Menu > Create Calibration Request... (F7) select the folder with the filled file for a last check and a Calibration Request file is created with the needed data as a single zip file.
  4. Email the Calibration Request file to info@CalibrationModel.com to develop the calibrations.

Ok that is it, the NIR-Predictor guides you through the steps needed. And if you need to know more details, the Chapter “Create Properties File” is for you.

Create Properties File

Note:

  • If you have (exported) JCAMP-DX files containing the Lab-Values, you don’t need to do this step.
    You can send the JCAMP file with your Request (.req) file directly to the calibration service at info@CalibrationModel.com.
  • If your JCAMP-DX files does NOT contain Lab-Values, this is a way to go.

For calibrating the spectra to the lab-values you need to assign the lab-values to the spectra. The easiest way is to have a table where each spectrum (row) is linked to multiple lab-values (columns). This function Create Properties File build such a table for the selected spectra folder automatically!

This table is stored in the file PropertiesBySamples.csv.txt. This can be created for any spectra folder you like. The file extension is .csv.txt to make it easy to edit in a text editor and also in a spreadsheet (excel). The columns are standard TAB separated.

The file header line contains :

Sample Replicates Names Prop1 Prop2 Prop3 DateFirst DateLast Hashes

Where Name and Date describes the spectrum.

Prop1, Prop2, Prop3 are the place to enter the Lab Reference Concentrations properties corresponding to each spectrum. It can be extended to Prop4, Prop5, … etc. Of course you can enter real word names like “Fat (%)” instead of “Prop1”. It’s recommended to put the measurement unit beside the name.

Replicates is the number of replicated or repeated spectra of a sample that is grouped together in the Sample based property file. Sample name and the DateFirst / DateLast between the sample spectra are measured.

Date format is ISO-8601. Missing Dates are 0002-02-02T00:00:00.0000000.

If the file PropertiesBySamples.csv.txt already exist in the selected folder, the user will be notified (it will not be overwritten, because the file may contain user entered Lab-values). The Lab Reference Concentrations values are initialized to 0 (zero) and needed to be changed.

Note: 0 is not interpreted as missing value! If you have a 0 concentration value, put in 0 or 0.0 .

The entry of properties is as easy as possible, because it’s organized by Sample (and not by Spectra), so it’s like your Lab-Value Table that is sample based. The sample rows are sorted in a special way by Sample name. Sorting by Date or alphabetically by Sample can done easily in a spreadsheet program.

Note: when coping lab values to the samples make sure they correspond, so that there are no gaps and the sorting is the same.

The Spectra (rows) are initially sorted by name (and date) to have the replicates/repeats together. You can sort for your convenience in a spreadsheet program.

Enter the Lab Reference Concentrations to the spectra/sample.

Enter the Lab-Values in spreadsheet (e.g. Excel) or a text editor (e.g. Notepad++). If done, use the next menu Create Calibration Request.

Hints: Data handling:

  • The NIR-Predictor creates the PropertiesBySamples.csv.txt once, after that the user is responsible for its content. That means NIR-Predictor does not change this file anymore.
  • You can remove entire rows (spectra) in the property file. You don’t need to remove the spectra files. The NIR-Predictor is aware of the relation, the PropertiesBySamples.csv.txt defines what will be calibrated.
  • How to add more spectra files?

    The additional spectra can be handled in a separate folder, create the property file and copy the spectra to the other folder and copy/merge the property files together in your editor or spreadsheet.

    Or

    Copy the spectra into the folder, rename the PropertiesBySamples.csv.txt to e.g. “PropertiesBySamples-Part1.csv.txt” and use Create Properties File to create a new PropertiesBySamples.csv.txt with all the spectra. You can copy/merge the content of the Properties files together in your editor or spreadsheet.

  • What happens with possible duplicate rows? It does no harm to the Calibration because we do an exact checking and data cleaning in the calibration process.
  • What happens to duplicate spectra names? The spectra names are not relevant for the calibration process. The spectra names are helpful to assign the lab-values to the corresponding spectrum entry. That’s why the table is initially sorted by name. The spectra names can be edited by the user.

Create Calibration Request

The menu function Create Calibration Request packs a created Properties file (see “Create Properties File”) and it’s linked spectra files in a compressed ZIP file for sending to the CalibrationModel.com Service.

Please note that the number of measured quantitative samples need to be at least 60 . That means you need at least 60 different spectra (not counting the replicate/repeated measurements).

It shows additional property information about the data you have entered, like – the property type (Quantitative) – it’s range (min – max) and – the number of unique values and – if the Lab-values are enough diverse to get calibrated.

First select the folder with the PropertiesBySamples.csv.txt and measured spectra files of samples you have Lab-values. The data is checked and you get notified what is missing or might be wrong. If something needs to be changed, edit the PropertiesBySamples.csv.txt and do Create Calibration Request again. Your last selected folder is remembered, so you can press return in the folder selection dialog.

Hint: The keyboard shortcuts for redoing it after you edited some entries is : F7 Return – that allows you to get the property information quickly.

Hint: If you open the PropertiesBySamples.csv.txt in a spreadsheet program, you can create Histogram plots of the entered Lab-values, to see in which range are to less samples measurements.

When all is fine

When all is fine the “CalibrationRequest.zip” file is created for that data.

The ZIP file contains:

  • your PropertiesBySamples.csv.txt
  • your personal REQuest file for your computer system, that looks like
    e.g. “337dcdc06b2d6dfb0b5c4bba578642312edf2ae84d909281624d7e26283e8b07 WIN-GB0PB48GSK4.req”
  • the spectra data files

Note: If the CalibrationRequest.zip file is already created and you change the PropertiesBySamples.csv.txt make sure to delete the old CalibrationRequest.zip file first! In the dialog it states if it was successfully created or NOT because it already exist. So you are always on the safe side.

Note: CalibrationRequest.zip file name contains the property names to know what would be calibrated and at the end an identification number for referencing the file. E.g. “CalibrationRequest ‘Prop1’ – ‘Prop2’ h31T3wOH.zip”


Program Settings

  • The users program settings are stored in UserSettings.json
  • The program counters are stored in GlobalCounters.json

Further References