Spectroscopy and Chemometrics News Weekly #32, 2019Spektroskopie und Chemometrie Neuigkeiten Wöchentlich #32, 2019Spettroscopia e Chemiometria Weekly News #32, 2019

CalibrationModel.com

Spectroscopy and Chemometrics News Weekly 31, 2019 | NIRS NIR Spectroscopy Chemometrics Spectrometer Spectrometric Analytical Chemistry Chemical Analysis Lab Labs Laboratories Laboratory Software Sensors QA QC Testing Quality Checking LINK

Spektroskopie und Chemometrie Neuigkeiten Wöchentlich 31, 2019 | NIRS NIR Spektroskopie Chemometrie Spektrometer Sensor Nahinfrarot Chemie Analytik Analysengeräte Analysemethode Nahinfrarotspektroskopie Laboranalyse Qualitätslabor LINK

Spettroscopia e Chemiometria Weekly News 31, 2019 | NIRS NIR Spettroscopia Chemiometria analisi chimica Spettrale Spettrometro Chem Sensore analitica Laboratorio analisi prova qualità Analysesystem prediction models Calibrazione LINK


Chemometrics

"Near infrared spectroscopic investigation of lipid oxidation in model solid food systems" LINK

Rapid quantification of the adulteration of fresh coconut water by dilution and sugars using Raman spectroscopy and chemometrics, published in Food Chemistry, is now OpenAccess via LINK

"Recent Progress in Rapid Analyses of Vitamins, Phenolic, and Volatile Compounds in Foods Using Vibrational Spectroscopy Combined with Chemometrics: a Review" LINK

" Beef Tenderness Prediction by a Combination of Statistical Methods: Chemometrics and Supervised Learning to Manage Integrative Farm-To-Meat Continuum Data" Foods LINK

"P-Wave VisibleShortwaveNear-Infrared (Vis-SW-NIR) Detection System for the Prediction of Soluble Solids Content and Firmness on Wax Apples" LINK

"Model development for soluble solids and lycopene contents of cherry tomato at different temperatures using near-infrared spectroscopy" LINK


Near Infrared

"Preliminary Assessment of Visible, Near-Infrared, and Short-Wavelength-Infrared Spectroscopy with a Portable Instrument for the Detection of Staphylococcus aureus Biofilms on Surfaces." LINK

" Inline monitoring of powder blend homogeneity in continuous drug manufacture using near infrared spectroscopy" LINK

"Nondestructive real-time assessment of sausage quality based on visible-near infrared spectrographic technique" LINK

"Lipid oxidation degree of pork meat during frozen storage investigated by near-infrared hyperspectral imaging: Effect of ice crystal growth and distribution" LINK

"High prevalence of cholesterol-rich atherosclerotic lesions in ancient mummies: A near-infrared spectroscopy study" LINK

"Application of Infrared Spectroscopy for Functional Compounds Evaluation in Olive Oil: A Current Snapshot" LINK

"Towards online Near-Infrared spectroscopy to optimise food product mixing" LINK


Hyperspectral

"Estimation of chlorophyll content in intertidal mangrove leaves with different thicknesses using hyperspectral data" LINK

"Snapshot Multispectral and Hyperspectral Data Processing for Estimating Food Quality Parameters" LINK


Environment

"Field Spectroscopy: A Non-Destructive Technique for Estimating Water Status in Vineyards" LINK

"Optical detection of contamination event in water distribution system using online Bayesian method with UVVis spectrometry" LINK


Agriculture

"GrassQ-A holistic precision grass measurement and analysis system to optimize pasture based livestock production" LINK

"Monitoring of Nitrogen and Grain Protein Content in Winter Wheat Based on Sentinel-2A Data" Remote Sensing LINK

"Identification and characterization of a fast-neutron-induced mutant with elevated seed protein content in soybean." LINK

"Sensors, Vol. 19, Pages 3147: NIR Hyperspectral Imaging Technology Combined with Multivariate Methods to Study the Residues of Different Concentrations of Omethoate on Wheat Grain Surface" LINK


Food & Feed

"Multi-target Prediction of wheat flour quality parameters with near infrared spectroscopy" LINK


Other

" Spectroscopic determination of leaf chlorophyll content and color for genetic selection on Sassafras tzumu" LINK

Record-breaking new analytical method for fingerprinting petroleum and other complex mixtures LINK

A record-breaking 244,779 molecular compositions within a sample of petroleum have been assigned using a powerful method of analysing and 'fingerprinting' chemical mixtures developed by at . Read more: LINK

"Optical properties of living corals determined with diffuse reflectance spectroscopy" LINK


NIR-PredictorNIR-PrädiktorNIR-Predittore

New: NIR-Predictor V2.6 with new features

The new Version of the free NIR-Predictor
supports GRAMS .SPC, CSV, JCAMP and multiple native file formats
of miniature, mobile and desktop spectrometers
get your spectra analyced as easy as Drag’n’Drop.

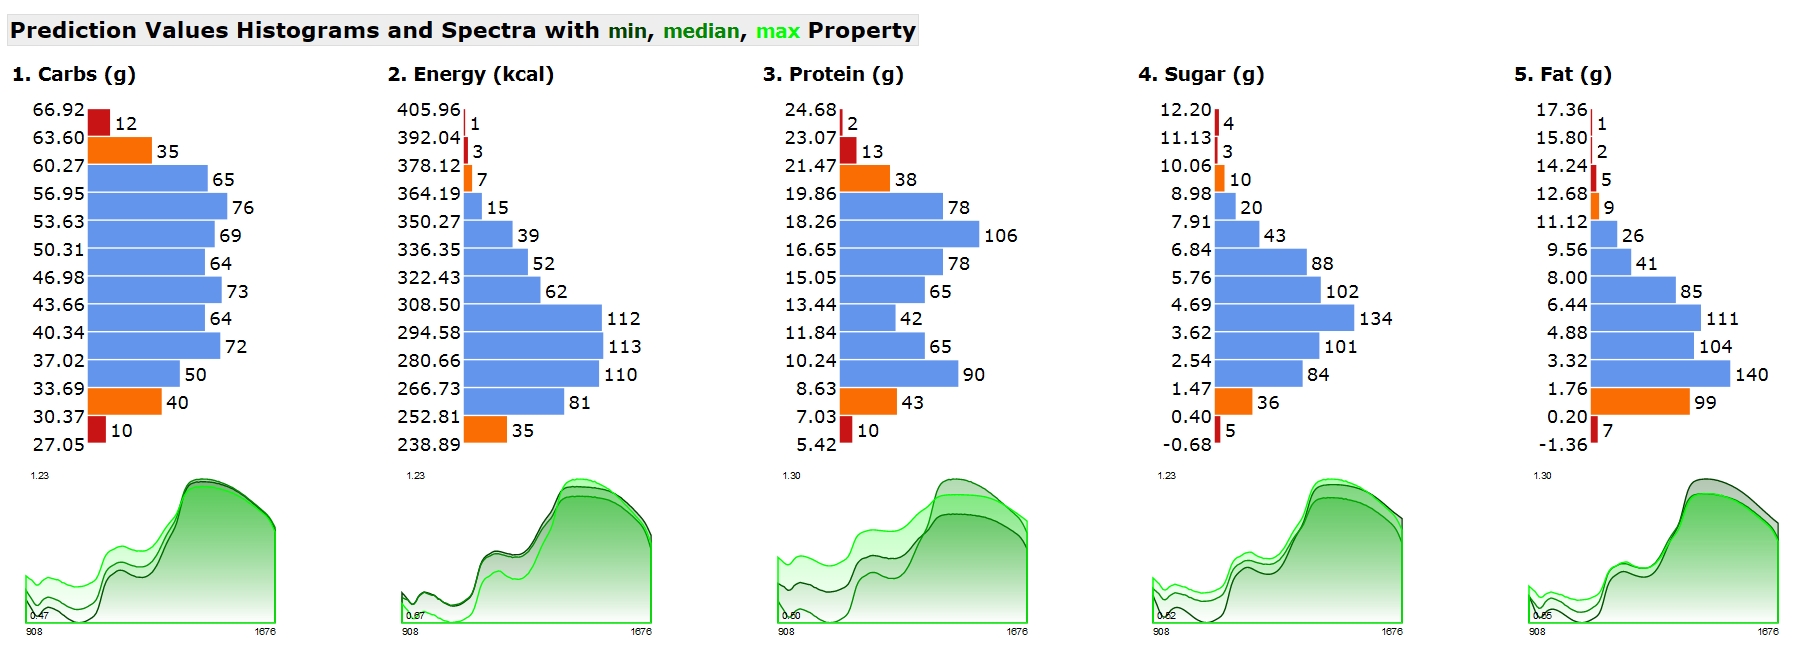
Spectra Plots and Histograms on the Prediction Report
  • NIR-Predictor is an easy to use NIR software for all NIR devices
    to produce quantitative results out of NIR data.

  • CalibrationModel Service provides development of
    customized calibrations out of NIR and Lab data.

  • It allows to use NIR with your own customized
    models without the need of Chemometric Software!

  • We do the Machine Leraning for your NIR-Spectrometer
    and with the free NIR-Predictor you are
    able to analyze new measured samples.

  • For NIR-Vendors we also offer the
    Software Development Kit (SDK) for OEM Predictor use
    via the Application Programming Interface (API).
    Think of a sencod predictor engine,
    as a second heart in your system.


Download

Key Features of NIR-Predictor

  • Super flexible prediction with automatic file format detection
  • Support for many mobile and desktop NIR Spectrometers file format
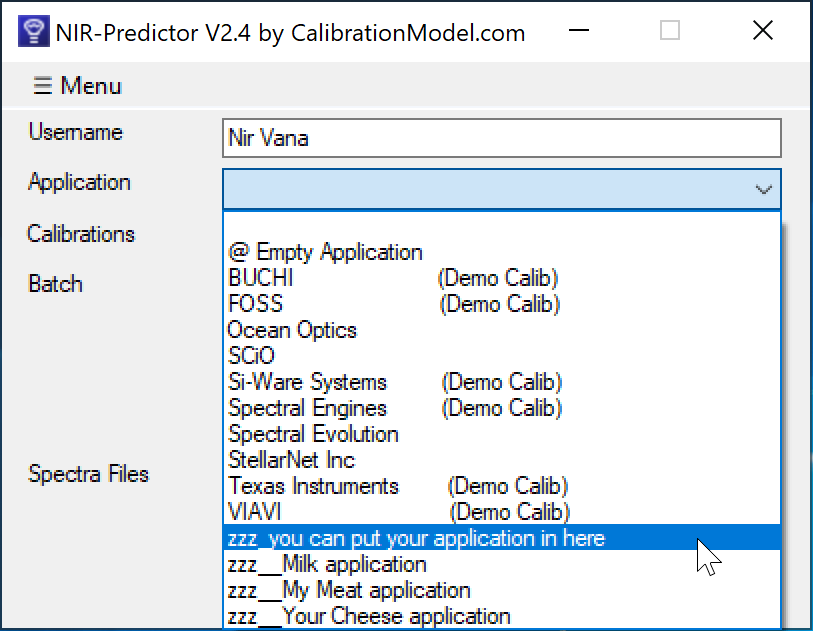
  • Application concept allows to group multiple Calibrations together for an Application
  • Prediction Report shows Histogram Charts of the tabulated prediction results
  • Sample based Properties File Creator for combining NIR and Lab reference data
  • Checked creation of a single file Calibration Request

Super flexible prediction

Loads multiple files at once in

  • different file-formats and …
  • different wave-ranges and wave-resolutions and …
  • predicts each spectrum with all compatible calibrations and …
  • merges the results in a report and …
  • saves the report as HTML.

It allows you to

  • comparing measurements
  • compare different calibrations
  • compare different spectrometers,
    carry out your own round-robin amongst the vendors’ instruments.
  • compare different spectra file formats

With no configuration and no special menu command,
just drag & drop your data files.

Videos


Properties File Creator

A tool for the NIR-User to create the property file easily. It helps to create a CSV file from the measured spectra files with sample names and properties to edit in Spreadsheet/EXCEL software. Lets you enter Lab-Reference-Values in a sample-based manner, corresponding to your sample spectra for calibration. It contains clever automatic analysis mechanisms of inconsistencies in your raw-data to increase the data quality for calibration. Provides detailed analyzer information for manual data cleanup when needed.

It’s time saving and less error prone because you DON’T need to open each spectrum file separately in an editor and copy the spectral values into a table grid beside the Lab-values.

Properties File Creator saves you from:

  • manually error prone and boring tasks
  • importing multiple data files and combining it’s content manually into a single data file to append the lab reference values (aka properties)
  • programming and writing scripts to transform the data into the shape needed
  • no trouble with data handling of
    • Wavelength / Wavenumber information (x-axis)
    • Absorbance / Reflectance labeling (y-axis)
    • checking compatibility of the raw data before merging
    • Averaging Spectral Intensities of a Sample
    • coping, flipping and transposing rows and colums to get the X-Block and Y-Block data sets ready for calibration modeling
    • limited and error prone table grid functionality

Because it’s all automatic and you can check the results and get the analysis information!

Properties File Creator provides you - a individual template based on your raw-data for combining NIR and Lab-values - analysis and checks for better data quality for calibration

Top 8 Reasons why you should use
Automated NIR Calibration Service

  • No subjective model selection
  • No variation in results and interpretation
  • No overfitting model
  • Better accuracy
  • Better precision
  • Time saving!
  • No software cost (no need for Chemometric software and training)
  • One free prediction software for all your NIR systems

Reduce Total Cost of Ownership (TCO) of your NIR

To be ahead of competitors
  • by not owning a chemometric software
  • by not struggling days with these complicated software
  • by not deep dive into chemometrics theory
It takes significant know-how and continous investment to develop calibrations
  • You need to have the relevant skill sets in your organization.
  • That means salaries (the biggest expense in most organizations)
To get most out of it, start now!
  • use the free NIR-Predictor together with your NIR-Instrument software
  • as an NIR-Vendor, integrate the free NIR-Predictor OEM into your NIR-Instrument software
  • don’t delay time-to-market
Read more about NIR Total cost of ownership (TCO)

Download


About the included Demo-Spectra and Demo-Calibrations

The demo calibrations for the spectrometers from

  • Si-Ware Systems
  • Spectral Engines
  • Texas Instruments
  • VIAVI

are built with the raw data, thankfully provided from Prof. Heinz W Siesler, from this publication

“Hand-held near-infrared spectrometers:
State-of-the-art instrumentation and practical applications”
Hui Yan, Heinz W Siesler
First Published August 20, 2018 Research Article
https://doi.org/10.1177/0960336018796391

The demo calibrations for the FOSS are built with the

ANSIG Kaji Competition 2014 shootout data
http://www.anisg.com.au/the-kaji-competition


References

Quickstart: NIR-Predictor - Manual

Features and Version History: NIR-Predictor - Release Notes History

Supported NIR Spectra Formats: NIR-Predictor supported Spectral Data File Formats

Frequently Asked Questions: NIR-Predictor - FAQ

WebShop : CalibrationModel WebShop

New: NIR-Predictor V2.6 with new features

The new Version of the free NIR-Predictor
supports GRAMS .SPC, CSV, JCAMP and multiple native file formats
of miniature, mobile and desktop spectrometers
get your spectra analyced as easy as Drag’n’Drop.

Spectra Plots and Histograms on the Prediction Report
  • NIR-Predictor is an easy to use NIR software for all NIR devices
    to produce quantitative results out of NIR data.

  • CalibrationModel Service provides development of
    customized calibrations out of NIR and Lab data.

  • It allows to use NIR with your own customized
    models without the need of Chemometric Software!

  • We do the Machine Leraning for your NIR-Spectrometer
    and with the free NIR-Predictor you are
    able to analyze new measured samples.

  • For NIR-Vendors we also offer the
    Software Development Kit (SDK) for OEM Predictor use
    via the Application Programming Interface (API).
    Think of a sencod predictor engine,
    as a second heart in your system.


Download

Key Features of NIR-Predictor

  • Super flexible prediction with automatic file format detection
  • Support for many mobile and desktop NIR Spectrometers file format
  • Application concept allows to group multiple Calibrations together for an Application
  • Prediction Report shows Histogram Charts of the tabulated prediction results
  • Sample based Properties File Creator for combining NIR and Lab reference data
  • Checked creation of a single file Calibration Request

Super flexible prediction

Loads multiple files at once in

  • different file-formats and …
  • different wave-ranges and wave-resolutions and …
  • predicts each spectrum with all compatible calibrations and …
  • merges the results in a report and …
  • saves the report as HTML.

It allows you to

  • comparing measurements
  • compare different calibrations
  • compare different spectrometers,
    carry out your own round-robin amongst the vendors’ instruments.
  • compare different spectra file formats

With no configuration and no special menu command,
just drag & drop your data files.

Videos


Properties File Creator

A tool for the NIR-User to create the property file easily. It helps to create a CSV file from the measured spectra files with sample names and properties to edit in Spreadsheet/EXCEL software. Lets you enter Lab-Reference-Values in a sample-based manner, corresponding to your sample spectra for calibration. It contains clever automatic analysis mechanisms of inconsistencies in your raw-data to increase the data quality for calibration. Provides detailed analyzer information for manual data cleanup when needed.

It’s time saving and less error prone because you DON’T need to open each spectrum file separately in an editor and copy the spectral values into a table grid beside the Lab-values.

Properties File Creator saves you from:

  • manually error prone and boring tasks
  • importing multiple data files and combining it’s content manually into a single data file to append the lab reference values (aka properties)
  • programming and writing scripts to transform the data into the shape needed
  • no trouble with data handling of
    • Wavelength / Wavenumber information (x-axis)
    • Absorbance / Reflectance labeling (y-axis)
    • checking compatibility of the raw data before merging
    • Averaging Spectral Intensities of a Sample
    • coping, flipping and transposing rows and colums to get the X-Block and Y-Block data sets ready for calibration modeling
    • limited and error prone table grid functionality

Because it’s all automatic and you can check the results and get the analysis information!

Properties File Creator provides you - a individual template based on your raw-data for combining NIR and Lab-values - analysis and checks for better data quality for calibration

Top 8 Reasons why you should use
Automated NIR Calibration Service

  • No subjective model selection
  • No variation in results and interpretation
  • No overfitting model
  • Better accuracy
  • Better precision
  • Time saving!
  • No software cost (no need for Chemometric software and training)
  • One free prediction software for all your NIR systems

Reduce Total Cost of Ownership (TCO) of your NIR

To be ahead of competitors
  • by not owning a chemometric software
  • by not struggling days with these complicated software
  • by not deep dive into chemometrics theory
It takes significant know-how and continous investment to develop calibrations
  • You need to have the relevant skill sets in your organization.
  • That means salaries (the biggest expense in most organizations)
To get most out of it, start now!
  • use the free NIR-Predictor together with your NIR-Instrument software
  • as an NIR-Vendor, integrate the free NIR-Predictor OEM into your NIR-Instrument software
  • don’t delay time-to-market
Read more about NIR Total cost of ownership (TCO)

Download


About the included Demo-Spectra and Demo-Calibrations

The demo calibrations for the spectrometers from

  • Si-Ware Systems
  • Spectral Engines
  • Texas Instruments
  • VIAVI

are built with the raw data, thankfully provided from Prof. Heinz W Siesler, from this publication

“Hand-held near-infrared spectrometers:
State-of-the-art instrumentation and practical applications”
Hui Yan, Heinz W Siesler
First Published August 20, 2018 Research Article
https://doi.org/10.1177/0960336018796391

The demo calibrations for the FOSS are built with the

ANSIG Kaji Competition 2014 shootout data
http://www.anisg.com.au/the-kaji-competition


References

Quickstart: NIR-Predictor - Manual

Features and Version History: NIR-Predictor - Release Notes History

Supported NIR Spectra Formats: NIR-Predictor supported Spectral Data File Formats

Frequently Asked Questions: NIR-Predictor - FAQ

WebShop : CalibrationModel WebShop