Spectroscopy and Chemometrics News Weekly #41, 2020Spektroskopie und Chemometrie Neuigkeiten Wöchentlich #41, 2020Spettroscopia e Chemiometria Weekly News #41, 2020

NIR Calibration-Model Services

Spectroscopy and Chemometrics News Weekly 40, 2020 | NIRS NIR Spectroscopy MachineLearning Spectrometer Spectrometric Analytical Chemistry Chemical Analysis Lab Labs Laboratories Laboratory Software IoT Sensors QA QC Testing Quality LINK
NIR-Spectroscopy and Chemometrics News Weekly 40, 2020 Spektroskopie und Chemometrie Neuigkeiten Wöchentlich 40, 2020 | NIRS NIR Spektroskopie MachineLearning Spektrometer IoT Sensor Nahinfrarot Chemie Analytik Analysengeräte Analysentechnik Analysemethode Nahinfrarotspektroskopie Laboranalyse LINK

Spettroscopia e Chemiometria Weekly News 40, 2020 | NIRS NIR Spettroscopia MachineLearning analisi chimica Spettrale Spettrometro Chem IoT Sensore Attrezzatura analitica Laboratorio analisi prova qualità Analysesystem QualityControl LINK


Near-Infrared Spectroscopy (NIRS)

"Comparison of four mobile, non‐invasive diagnostic techniques for differentiating glass types in historical leaded windows: MA‐XRF, UV–Vis–NIR, Raman …" LINK

"NIR associated to PLS and SVM for fast and non-destructive determination of C, N, P, and K contents in poultry litter" LINK

"Feasibility of FT-NIR spectroscopy and Vis/NIR hyperspectral imaging for sorting unsound chestnuts" LINK

"Estimating purple-soil moisture content using Vis-NIR spectroscopy" | LINK


Infrared Spectroscopy (IR) and Near-Infrared Spectroscopy (NIR)

"Classification approaches for sorting maize (Zea mays subsp. mays) haploids using single‐kernel near‐infrared spectroscopy" LINK

"Near Infrared and Aquaphotomic analysis of water absorption in lactate containing media" LINK

"Classification of Imbalanced Near-infrared Spectroscopy Data" LINK

"Meat freshness revealed by visible to near-infrared spectroscopy and principal component analysis" LINK

"Measurement of the diffusion coefficient and hydrogen bonds of water in a dry-protective solution by microscopic near-infrared spectroscopy" LINK

"Authentication of Antibiotics Using Portable Near-Infrared Spectroscopy and Multivariate Data Analysis" LINK

"Infrared spectroscopy approaches support soil organic carbon estimations to evaluate land degradation" LINK

"Assessment of some wood properties by near infrared spectroscopy" LINK

"Impact of spectroscopic information on total column water vapor retrieval in the near-infrared spectral region" LINK

"Prediction of intramuscular fat in lamb by visible and near-infrared spectroscopy in an abattoir environment" LINK


Raman Spectroscopy

"Principal Component Regression for Forensic Age Determination Using the Raman Spectra of Teeth" LINK


Hyperspectral Imaging (HSI)

"Rapid and nondestructive evaluation of hygroscopic behavior changes of thermally modified softwood and hardwood samples using near-infrared hyperspectral imaging (NIR-HSI)" LINK

"Differentiation of Environmental Bacteria Using Hyperspectral Imaging Technology And Multivariate Analysis" LINK


Chemometrics and Machine Learning

"Comprehensive chemometric classification of snack products based on their near infrared spectra" LINK

"Adulteration detection of corn oil, rapeseed oil and sunflower oil in camellia oil by in situ diffuse reflectance near-infrared spectroscopy and chemometrics" LINK

"Near-Infrared Spectroscopy Coupled Chemometric Algorithms for Rapid Origin Identification and Lipid Content Detection of Pinus Koraiensis Seeds" Sensors LINK

"Application of Generative Adversarial Network for the Prediction of Gasoline Properties" LINK

"Near Infrared Reflectance Spectroscopy Coupled to Chemometrics as a Cost-Effective, Rapid and Non-Destructive Tool for Fish Fraud Control: Monitoring Source …" LINK

"Using chemometrics to characterise and unravel the near infra-red spectral changes induced in aubergine fruit by chilling injury as influenced by storage time and …" LINK


Equipment for Spectroscopy

"Water as a probe to understand the traditional Chinese medicine extraction process with near infrared spectroscopy: a case of Danshen (Salvia miltiorrhiza Bge) …" LINK


Process Control and NIR Sensors

"Sample Mass Estimate for the Use of Near-Infrared and Raman Spectroscopy to Monitor Content Uniformity in a Tablet Press Feed Frame of a Drug Product Continuous Manufacturing Process" LINK


Environment NIR-Spectroscopy Application

"ESTIMATION OF SOIL HEAVY METAL COMBINING FRACTIONAL ORDER DERIVATIVE" LINK

"Metabolomics approaches for analysing effects of geographic and environmental factors on the variation of root essential oils of Ferula assa-foetida L." LINK


Agriculture NIR-Spectroscopy Usage

"Principles and Applications of Vibrational Spectroscopic Imaging in Plant Science: A Review." LINK


Food & Feed Industry NIR Usage

"Multi-block classification of chocolate and cocoa samples into sensory poles" LINK


Pharma Industry NIR Usage

"Rapid quantification of active pharmaceutical ingredient for sugar-free Yangwei granules in commercial production using FT-NIR spectroscopy based on machine …" LINK


Laboratory and NIR-Spectroscopy

"Resin and volatile content of melamine-impregnated paper assessed by near infrared spectroscopy, a simulation of the industrial process using a laboratory-scale …" | LINK


Other

"Development of an automatic sorting robot for construction and demolition waste" LINK

"SEASONAL SPECTRAL SEPARABILITY OF SELECTED GRASSES: CASE STUDY FROM THE KRKONOŠE MTS. TUNDRA ECOSYSTEM" LINK

"Polymer types ingested by northern fulmars (Fulmarus glacialis) and southern hemisphere relatives." LINK

"High-sensitive spectroscopy for remote sensing of concrete structures" LINK


NIR Calibration-Model Services

Spectroscopy and Chemometrics News Weekly 40, 2020 | NIRS NIR Spectroscopy MachineLearning Spectrometer Spectrometric Analytical Chemistry Chemical Analysis Lab Labs Laboratories Laboratory Software IoT Sensors QA QC Testing Quality LINK

NIR-Spectroscopy and Chemometrics News Weekly 40, 2020 Spektroskopie und Chemometrie Neuigkeiten Wöchentlich 40, 2020 | NIRS NIR Spektroskopie MachineLearning Spektrometer IoT Sensor Nahinfrarot Chemie Analytik Analysengeräte Analysentechnik Analysemethode Nahinfrarotspektroskopie Laboranalyse LINK

Spettroscopia e Chemiometria Weekly News 40, 2020 | NIRS NIR Spettroscopia MachineLearning analisi chimica Spettrale Spettrometro Chem IoT Sensore Attrezzatura analitica Laboratorio analisi prova qualità Analysesystem QualityControl LINK


Near-Infrared Spectroscopy (NIRS)

"Comparison of four mobile, non‐invasive diagnostic techniques for differentiating glass types in historical leaded windows: MA‐XRF, UV–Vis–NIR, Raman …" LINK

"NIR associated to PLS and SVM for fast and non-destructive determination of C, N, P, and K contents in poultry litter" LINK

"Feasibility of FT-NIR spectroscopy and Vis/NIR hyperspectral imaging for sorting unsound chestnuts" LINK

"Estimating purple-soil moisture content using Vis-NIR spectroscopy" | LINK


Infrared Spectroscopy (IR) and Near-Infrared Spectroscopy (NIR)

"Classification approaches for sorting maize (Zea mays subsp. mays) haploids using single‐kernel near‐infrared spectroscopy" LINK

"Near Infrared and Aquaphotomic analysis of water absorption in lactate containing media" LINK

"Classification of Imbalanced Near-infrared Spectroscopy Data" LINK

"Meat freshness revealed by visible to near-infrared spectroscopy and principal component analysis" LINK

"Measurement of the diffusion coefficient and hydrogen bonds of water in a dry-protective solution by microscopic near-infrared spectroscopy" LINK

"Authentication of Antibiotics Using Portable Near-Infrared Spectroscopy and Multivariate Data Analysis" LINK

"Infrared spectroscopy approaches support soil organic carbon estimations to evaluate land degradation" LINK

"Assessment of some wood properties by near infrared spectroscopy" LINK

"Impact of spectroscopic information on total column water vapor retrieval in the near-infrared spectral region" LINK

"Prediction of intramuscular fat in lamb by visible and near-infrared spectroscopy in an abattoir environment" LINK


Raman Spectroscopy

"Principal Component Regression for Forensic Age Determination Using the Raman Spectra of Teeth" LINK


Hyperspectral Imaging (HSI)

"Rapid and nondestructive evaluation of hygroscopic behavior changes of thermally modified softwood and hardwood samples using near-infrared hyperspectral imaging (NIR-HSI)" LINK

"Differentiation of Environmental Bacteria Using Hyperspectral Imaging Technology And Multivariate Analysis" LINK


Chemometrics and Machine Learning

"Comprehensive chemometric classification of snack products based on their near infrared spectra" LINK

"Adulteration detection of corn oil, rapeseed oil and sunflower oil in camellia oil by in situ diffuse reflectance near-infrared spectroscopy and chemometrics" LINK

"Near-Infrared Spectroscopy Coupled Chemometric Algorithms for Rapid Origin Identification and Lipid Content Detection of Pinus Koraiensis Seeds" Sensors LINK

"Application of Generative Adversarial Network for the Prediction of Gasoline Properties" LINK

"Near Infrared Reflectance Spectroscopy Coupled to Chemometrics as a Cost-Effective, Rapid and Non-Destructive Tool for Fish Fraud Control: Monitoring Source …" LINK

"Using chemometrics to characterise and unravel the near infra-red spectral changes induced in aubergine fruit by chilling injury as influenced by storage time and …" LINK


Equipment for Spectroscopy

"Water as a probe to understand the traditional Chinese medicine extraction process with near infrared spectroscopy: a case of Danshen (Salvia miltiorrhiza Bge) …" LINK


Process Control and NIR Sensors

"Sample Mass Estimate for the Use of Near-Infrared and Raman Spectroscopy to Monitor Content Uniformity in a Tablet Press Feed Frame of a Drug Product Continuous Manufacturing Process" LINK


Environment NIR-Spectroscopy Application

"ESTIMATION OF SOIL HEAVY METAL COMBINING FRACTIONAL ORDER DERIVATIVE" LINK

"Metabolomics approaches for analysing effects of geographic and environmental factors on the variation of root essential oils of Ferula assa-foetida L." LINK


Agriculture NIR-Spectroscopy Usage

"Principles and Applications of Vibrational Spectroscopic Imaging in Plant Science: A Review." LINK


Food & Feed Industry NIR Usage

"Multi-block classification of chocolate and cocoa samples into sensory poles" LINK


Pharma Industry NIR Usage

"Rapid quantification of active pharmaceutical ingredient for sugar-free Yangwei granules in commercial production using FT-NIR spectroscopy based on machine …" LINK


Laboratory and NIR-Spectroscopy

"Resin and volatile content of melamine-impregnated paper assessed by near infrared spectroscopy, a simulation of the industrial process using a laboratory-scale …" | LINK


Other

"Development of an automatic sorting robot for construction and demolition waste" LINK

"SEASONAL SPECTRAL SEPARABILITY OF SELECTED GRASSES: CASE STUDY FROM THE KRKONOŠE MTS. TUNDRA ECOSYSTEM" LINK

"Polymer types ingested by northern fulmars (Fulmarus glacialis) and southern hemisphere relatives." LINK

"High-sensitive spectroscopy for remote sensing of concrete structures" LINK


NIR Calibration-Model Services

Spectroscopy and Chemometrics News Weekly 40, 2020 | NIRS NIR Spectroscopy MachineLearning Spectrometer Spectrometric Analytical Chemistry Chemical Analysis Lab Labs Laboratories Laboratory Software IoT Sensors QA QC Testing Quality LINK

NIR-Spectroscopy and Chemometrics News Weekly 40, 2020 Spektroskopie und Chemometrie Neuigkeiten Wöchentlich 40, 2020 | NIRS NIR Spektroskopie MachineLearning Spektrometer IoT Sensor Nahinfrarot Chemie Analytik Analysengeräte Analysentechnik Analysemethode Nahinfrarotspektroskopie Laboranalyse LINK

Spettroscopia e Chemiometria Weekly News 40, 2020 | NIRS NIR Spettroscopia MachineLearning analisi chimica Spettrale Spettrometro Chem IoT Sensore Attrezzatura analitica Laboratorio analisi prova qualità Analysesystem QualityControl LINK


Near-Infrared Spectroscopy (NIRS)

"Comparison of four mobile, non‐invasive diagnostic techniques for differentiating glass types in historical leaded windows: MA‐XRF, UV–Vis–NIR, Raman …" LINK

"NIR associated to PLS and SVM for fast and non-destructive determination of C, N, P, and K contents in poultry litter" LINK

"Feasibility of FT-NIR spectroscopy and Vis/NIR hyperspectral imaging for sorting unsound chestnuts" LINK

"Estimating purple-soil moisture content using Vis-NIR spectroscopy" | LINK


Infrared Spectroscopy (IR) and Near-Infrared Spectroscopy (NIR)

"Classification approaches for sorting maize (Zea mays subsp. mays) haploids using single‐kernel near‐infrared spectroscopy" LINK

"Near Infrared and Aquaphotomic analysis of water absorption in lactate containing media" LINK

"Classification of Imbalanced Near-infrared Spectroscopy Data" LINK

"Meat freshness revealed by visible to near-infrared spectroscopy and principal component analysis" LINK

"Measurement of the diffusion coefficient and hydrogen bonds of water in a dry-protective solution by microscopic near-infrared spectroscopy" LINK

"Authentication of Antibiotics Using Portable Near-Infrared Spectroscopy and Multivariate Data Analysis" LINK

"Infrared spectroscopy approaches support soil organic carbon estimations to evaluate land degradation" LINK

"Assessment of some wood properties by near infrared spectroscopy" LINK

"Impact of spectroscopic information on total column water vapor retrieval in the near-infrared spectral region" LINK

"Prediction of intramuscular fat in lamb by visible and near-infrared spectroscopy in an abattoir environment" LINK


Raman Spectroscopy

"Principal Component Regression for Forensic Age Determination Using the Raman Spectra of Teeth" LINK


Hyperspectral Imaging (HSI)

"Rapid and nondestructive evaluation of hygroscopic behavior changes of thermally modified softwood and hardwood samples using near-infrared hyperspectral imaging (NIR-HSI)" LINK

"Differentiation of Environmental Bacteria Using Hyperspectral Imaging Technology And Multivariate Analysis" LINK


Chemometrics and Machine Learning

"Comprehensive chemometric classification of snack products based on their near infrared spectra" LINK

"Adulteration detection of corn oil, rapeseed oil and sunflower oil in camellia oil by in situ diffuse reflectance near-infrared spectroscopy and chemometrics" LINK

"Near-Infrared Spectroscopy Coupled Chemometric Algorithms for Rapid Origin Identification and Lipid Content Detection of Pinus Koraiensis Seeds" Sensors LINK

"Application of Generative Adversarial Network for the Prediction of Gasoline Properties" LINK

"Near Infrared Reflectance Spectroscopy Coupled to Chemometrics as a Cost-Effective, Rapid and Non-Destructive Tool for Fish Fraud Control: Monitoring Source …" LINK

"Using chemometrics to characterise and unravel the near infra-red spectral changes induced in aubergine fruit by chilling injury as influenced by storage time and …" LINK


Equipment for Spectroscopy

"Water as a probe to understand the traditional Chinese medicine extraction process with near infrared spectroscopy: a case of Danshen (Salvia miltiorrhiza Bge) …" LINK


Process Control and NIR Sensors

"Sample Mass Estimate for the Use of Near-Infrared and Raman Spectroscopy to Monitor Content Uniformity in a Tablet Press Feed Frame of a Drug Product Continuous Manufacturing Process" LINK


Environment NIR-Spectroscopy Application

"ESTIMATION OF SOIL HEAVY METAL COMBINING FRACTIONAL ORDER DERIVATIVE" LINK

"Metabolomics approaches for analysing effects of geographic and environmental factors on the variation of root essential oils of Ferula assa-foetida L." LINK


Agriculture NIR-Spectroscopy Usage

"Principles and Applications of Vibrational Spectroscopic Imaging in Plant Science: A Review." LINK


Food & Feed Industry NIR Usage

"Multi-block classification of chocolate and cocoa samples into sensory poles" LINK


Pharma Industry NIR Usage

"Rapid quantification of active pharmaceutical ingredient for sugar-free Yangwei granules in commercial production using FT-NIR spectroscopy based on machine …" LINK


Laboratory and NIR-Spectroscopy

"Resin and volatile content of melamine-impregnated paper assessed by near infrared spectroscopy, a simulation of the industrial process using a laboratory-scale …" | LINK


Other

"Development of an automatic sorting robot for construction and demolition waste" LINK

"SEASONAL SPECTRAL SEPARABILITY OF SELECTED GRASSES: CASE STUDY FROM THE KRKONOŠE MTS. TUNDRA ECOSYSTEM" LINK

"Polymer types ingested by northern fulmars (Fulmarus glacialis) and southern hemisphere relatives." LINK

"High-sensitive spectroscopy for remote sensing of concrete structures" LINK


NIR Analysis in Laboratory and Laboratories – aka NIR Labs and NIR testingNIR-Analyse im Labor und in Laboratorien – aka NIR-Labore und NIR-TestsAnalisi NIR in laboratorio e nei laboratori – noti anche come laboratori NIR e test NIR


Do you have a NIR spectrometer in your Lab?

How many other analytics you do in the Lab could be done faster and cheaper with NIR?

Is this possible and precise enough?

Try, we have the solution for you!
You have the NIR, scan the samples, you have the lab values and the spectra, we calibrate for you!

To see if the application is possible and how precise it can be due to knowledge based intensive model optimizations.

We do the NIR feasibility study with data for you. Fixed prices

NIR has huge application potentials and it's a Green analytical method, that's fast and easy to use. And has today the possibility to scale out with inexpensive mobile NIR spectrometers.

Bring the Lab to the sample. To avoid sample transport and get immediate results for decision at the place or in the process.

Just try the NIR application, use the NIR daily, collect data in parallel, we develop, optimize and maintain the calibration models for you.

How do you think?

Start Calibrate


What is possible today with NIR?
The number of different Applications exploded in the last 2-3 years!
See NIR research papers news daily on @CalibModel or the 7-day summaries "NIR News Weekly" here.

Haben Sie ein NIR-Spektrometer in Ihrem Labor?

Wie viele andere Analysen, die Sie im Labor durchführen, könnten mit NIR schneller und billiger durchgeführt werden?

Ist dies möglich und präzise genug?

Versuchen Sie es, wir haben die Lösung für Sie!
Sie haben das NIR, scannen sie Proben, Sie haben die Laborwerte und die Spektren, wir kalibrieren für Sie!

Um zu sehen, ob die Anwendung möglich ist und wie präzise sie aufgrund von wissensbasierten intensiven Modelloptimierungen sein kann.

Wir führen die NIR-Machbarkeitsstudie mit Daten für Sie durch. Fixpreise

NIR hat ein riesiges Anwendungspotential und ist eine grüne Analysemethode, die schnell und einfach anzuwenden ist. Und hat heute die Möglichkeit, mit kostengünstigen mobilen NIR-Spektrometern zu skalieren.

Bringen Sie das Labor zu der Probe. So vermeiden Sie den Probentransport und erhalten sofortige Ergebnisse zur Entscheidung am Ort oder im Prozess.

Probieren Sie einfach die NIR-Anwendung aus, nutzen Sie das NIR täglich, sammeln Sie parallel dazu Daten, wir entwickeln, optimieren und warten die Kalibriermodelle für Sie.

Wie denken Sie darüber?

Start Calibrate


Was ist heute mit NIR möglich?
Die Zahl der verschiedenen Anwendungen ist in den letzten 2-3 Jahren explodiert!
Sehen Sie hier die täglichen NIR-Forschungsberichte über @CalibModel oder die 7-Tage-Zusammenfassungen "NIR News Weekly".

Avete uno spettrometro NIR nel vostro laboratorio?

Quante altre analisi si possono fare in laboratorio in modo più veloce ed economico con il NIR?

È possibile e sufficientemente preciso?

Provate, abbiamo la soluzione per voi!
Avete il NIR, scansionate i campioni, avete i valori di laboratorio e gli spettri, noi calibriamo per voi!

Per vedere se l'applicazione è possibile e quanto precisa può essere grazie all'ottimizzazione intensiva del modello basata sulla conoscenza.
Facciamo lo studio di fattibilità NIR con i dati per voi. Prezzi fissi

Il NIR ha enormi potenzialità applicative ed è un metodo analitico Green, veloce e facile da usare. E ha oggi la possibilità di scalare con gli economici spettrometri mobili NIR.
Portate il laboratorio al campione. Per evitare il trasporto del campione e ottenere risultati immediati per la decisione sul posto o nel processo.

Basta provare l'applicazione NIR, usare il NIR quotidianamente, raccogliere dati in parallelo, noi sviluppiamo, ottimizziamo e manteniamo i modelli di calibrazione per voi.

Come pensate di fare?

Inizia a calibrare


Cosa è possibile oggi con il NIR?
Il numero di diverse Applicazioni è esploso negli ultimi 2-3 anni!
Vedi le notizie dei giornali di ricerca NIR su @CalibModel o i riassunti di 7 giorni "NIR News Weekly" qui.
________________________________________________

Análise NIR no laboratório e laboratórios - também conhecidos como laboratórios NIR e testes NIR


Tem um espectrómetro NIR no seu laboratório?

Quantas outras análises que faz no Laboratório poderiam ser feitas mais rapidamente e mais baratas com o NIR? Será isto possível e suficientemente preciso?

Tente, nós temos a solução para si!

Tem o NIR, digitaliza as amostras, tem os valores de laboratório e os espectros, nós calibramos para si! Para ver se a aplicação é possível e quão precisa pode ser devido a optimizações de modelos intensivas baseadas no conhecimento.
Fazemos o estudo de viabilidade do NIR com dados para si. Preços fixos

NIR tem um enorme potencial de aplicação e é um método analítico Verde, que é rápido e fácil de usar. E tem hoje a possibilidade de ser escalado com espectrómetros NIR móveis de baixo custo.

Traga o Laboratório para a amostra. Para evitar o transporte de amostras e obter resultados imediatos para decisão no local ou no processo.

Basta experimentar a aplicação NIR, utilizar o NIR diariamente, recolher dados em paralelo, nós desenvolvemos, optimizamos e mantemos os modelos de calibração para si.

Como pensa?

Iniciar a calibração


O que é possível hoje com o NIR?
O número de diferentes Aplicações explodiu nos últimos 2-3 anos!
Ver os jornais de investigação NIR diariamente sobre @CalibModel ou os resumos de 7 dias "NIR News Weekly" aqui.
________________________________________________

El análisis NIR en el laboratorio y los laboratorios - también conocidos como laboratorios NIR y pruebas NIR


Tiene un espectrómetro NIR en su laboratorio?

Cuántos análisis más haces en el laboratorio podrían hacerse más rápido y más barato con el NIR? Es esto posible y suficientemente preciso?

¡Inténtelo, tenemos la solución para usted!
Tienes el NIR, escaneas las muestras, tienes los valores del laboratorio y los espectros, ¡calibramos para ti!

Para ver si la aplicación es posible y cuán precisa puede ser gracias a las optimizaciones intensivas de modelos basadas en el conocimiento.

Hacemos el estudio de viabilidad del NIR con los datos para usted. Precios fijos

El NIR tiene un enorme potencial de aplicación y es un método analítico verde, que es rápido y fácil de usar. Y tiene hoy la posibilidad de escalar con espectrómetros NIR móviles baratos.
Trae el laboratorio a la muestra. Para evitar el transporte de la muestra y obtener resultados inmediatos para la decisión en el lugar o en el proceso.

Pruebe la aplicación NIR, utilice el NIR diariamente, recoja los datos en paralelo, nosotros desarrollamos, optimizamos y mantenemos los modelos de calibración para usted.

Cómo cree usted?

Comenzar a calibrar


Qué es posible hoy en día con el NIR?
¡El número de aplicaciones diferentes explotó en los últimos 2-3 años!
Vea las noticias diarias de los trabajos de investigación del NIR en @CalibModel o los resúmenes de 7 días "NIR News Weekly" aquí.

Spectroscopy and Chemometrics News Weekly #35, 2020Spektroskopie und Chemometrie Neuigkeiten Wöchentlich #35, 2020Spettroscopia e Chemiometria Weekly News #35, 2020

NIR Calibration-Model Services

Spectroscopy and Chemometrics News Weekly 34, 2020 | NIRS NIR Spectroscopy MachineLearning Spectrometer Spectrometric Analytical Chemistry Chemical Analysis Lab Labs Laboratories Laboratory Software IoT Sensors QA QC Testing Quality LINK

This week's NIR news Weekly is sponsored by Your-Company-Name-Here - NIR-spectrometers. Check out their product page ... link

Get the Chemometrics and Spectroscopy News in real time on Twitter @ CalibModel and follow us.


Near-Infrared Spectroscopy (NIRS)

"Modelos NIRS para as características químicas da madeira de Eucalyptus benthamii Maiden & Cambage" LINK

"Application of in situ near infra-red spectroscopy (NIRS) for monitoring biopharmaceuticals production by cell cultures" LINK

"Using the NIRS for analyzes of soil clay content" LINK

"Determination of compost maturity using near infrared spectroscopy (NIRS)" LINK

"Screening Risk Assessment of Agricultural Areas under a High Level of Anthropopressure Based on Chemical Indexes and VIS-NIR Spectroscopy" LINK

"… an algorithm for processing Red Green Blue (RGB) images for the estimation of crude protein in grasses vs Near Infrared Reflectance Spectroscopy Technology (NIRS …" LINK

"Monitoring of cheese maturation using near infrared-hyperspectral imaging (NIR-HIS)" LINK

"Selection of sugarcane clones via multivariate models using near-infrared (NIR) spectroscopy data" LINK


Infrared Spectroscopy (IR) and Near-Infrared Spectroscopy (NIR)

"Rapid and simultaneous analysis of multiple wine quality indicators through near-infrared spectroscopy with twice optimization for wavelength model" LINK

"Manuka honey adulteration detection based on near-infrared spectroscopy combined with aquaphotomics" LINK

" Identification of Marine Fish Taxa by Linear Discriminant Analysis of Reflection Spectra in the Near-Infrared Region" LINK

"Assessment of Intact Macadamia Nut Internal Defects Using Near-Infrared Spectroscopy" LINK

"Rational design of near-infrared platinum(ii)-acetylide conjugated polymers for photoacoustic imaging-guided synergistic phototherapy under 808 nm irradiation." LINK

"Classification of fish species from different ecosystems using the near infrared diffuse reflectance spectra of otoliths" LINK

"Three new Amazonian species of Myrcia sect. Myrcia (Myrtaceae) based on morphology and near-infrared spectroscopy" LINK

"Rapid Online Determination of Feed Concentration in Nitroguanidine Spray Drying Process by Near Infrared Spectroscopy" LINK


Raman Spectroscopy

"Monitoring the Caustic Dissolution of Aluminum Alloy in a Radiochemical Hot Cell Using Raman Spectroscopy" LINK


Hyperspectral Imaging (HSI)

"Hyperspectral Imaging and Deep Learning for Food Safety Assessment" LINK


Chemometrics and Machine Learning

"Rapid and Nondestructive Freshness Determination of Tilapia Fillets by a Portable Near-Infrared Spectrometer Combined with Chemometrics Methods" LINK

"Non-Targeted Detection of Adulterants in Almond Powder Using Spectroscopic Techniques Combined with Chemometrics." LINK


Environment NIR-Spectroscopy Application

"Mobile Proximal Sensing with Visible and Near Infrared Spectroscopy for Digital Soil Mapping" LINK


Agriculture NIR-Spectroscopy Usage

"Imaging Techniques for Chicken Products Detection" LINK

"Usage of visual and near-infrared spectroscopy to predict soil properties in forest stands" LINK

"NUTRIENT CONTENT OF SOYBEAN MEAL FROM DIFFERENT ORIGINS BASED ON NEAR INFRARED REFLECTANCE SPECTROSCOPY" LINK

"Robustness of visible near-infrared and mid-infrared spectroscopic models to changes in the quantity and quality of crop residues in soil" LINK

"Use of leaf hyperspectral data and different regression models to estimate photosynthetic parameters (Vcmax and Jmax) in three different row crops" LINK

"Rapid and direct detection of small microplastics in aquatic samples by a new near infrared hyperspectral imaging (NIR-HSI) method" LINK


Horticulture NIR-Spectroscopy Applications

"Prediction of Soluble Solids Content During Storage of Apples with Different Maturity Based on VIS/NIR Spectroscopy" LINK

"A new spectral pretreatment method for detecting soluble solids content of pears using Vis/NIR spectroscopy" LINK

"Research on the Performance of Juicy Peach Sugar Content Detection Model Based on Near Infrared Spectroscopy" LINK


Forestry and Wood Industry NIR Usage

"The Effect of Construction and Demolition Waste Plastic Fractions on Wood-Polymer Composite Properties" LINK


Food & Feed Industry NIR Usage

"Non-destructive Assessment of Flesh Firmness and Dietary Antioxidants of Greenhouse-grown Tomato (Solanum lycopersicum L.) at Different Fruit Maturity Stages" LINK

"Comparative analysis of rice seed viability detection based on different spectral bands" LINK

"Detection of chocolate powder adulteration with peanut using near-infrared hyperspectral imaging and Multivariate Curve Resolution" LINK


NIR Calibration-Model Services

Spektroskopie und Chemometrie Neuigkeiten Wöchentlich 34, 2020 | NIRS NIR Spektroskopie MachineLearning Spektrometer IoT Sensor Nahinfrarot Chemie Analytik Analysengeräte Analysentechnik Analysemethode Nahinfrarotspektroskopie Laboranalyse LINK

This week's NIR news Weekly is sponsored by Your-Company-Name-Here - NIR-spectrometers. Check out their product page ... link

Get the Chemometrics and Spectroscopy News in real time on Twitter @ CalibModel and follow us.


Near-Infrared Spectroscopy (NIRS)

"Modelos NIRS para as características químicas da madeira de Eucalyptus benthamii Maiden & Cambage" LINK

"Application of in situ near infra-red spectroscopy (NIRS) for monitoring biopharmaceuticals production by cell cultures" LINK

"Using the NIRS for analyzes of soil clay content" LINK

"Determination of compost maturity using near infrared spectroscopy (NIRS)" LINK

"Screening Risk Assessment of Agricultural Areas under a High Level of Anthropopressure Based on Chemical Indexes and VIS-NIR Spectroscopy" LINK

"… an algorithm for processing Red Green Blue (RGB) images for the estimation of crude protein in grasses vs Near Infrared Reflectance Spectroscopy Technology (NIRS …" LINK

"Monitoring of cheese maturation using near infrared-hyperspectral imaging (NIR-HIS)" LINK

"Selection of sugarcane clones via multivariate models using near-infrared (NIR) spectroscopy data" LINK


Infrared Spectroscopy (IR) and Near-Infrared Spectroscopy (NIR)

"Rapid and simultaneous analysis of multiple wine quality indicators through near-infrared spectroscopy with twice optimization for wavelength model" LINK

"Manuka honey adulteration detection based on near-infrared spectroscopy combined with aquaphotomics" LINK

" Identification of Marine Fish Taxa by Linear Discriminant Analysis of Reflection Spectra in the Near-Infrared Region" LINK

"Assessment of Intact Macadamia Nut Internal Defects Using Near-Infrared Spectroscopy" LINK

"Rational design of near-infrared platinum(ii)-acetylide conjugated polymers for photoacoustic imaging-guided synergistic phototherapy under 808 nm irradiation." LINK

"Classification of fish species from different ecosystems using the near infrared diffuse reflectance spectra of otoliths" LINK

"Three new Amazonian species of Myrcia sect. Myrcia (Myrtaceae) based on morphology and near-infrared spectroscopy" LINK

"Rapid Online Determination of Feed Concentration in Nitroguanidine Spray Drying Process by Near Infrared Spectroscopy" LINK


Raman Spectroscopy

"Monitoring the Caustic Dissolution of Aluminum Alloy in a Radiochemical Hot Cell Using Raman Spectroscopy" LINK


Hyperspectral Imaging (HSI)

"Hyperspectral Imaging and Deep Learning for Food Safety Assessment" LINK


Chemometrics and Machine Learning

"Rapid and Nondestructive Freshness Determination of Tilapia Fillets by a Portable Near-Infrared Spectrometer Combined with Chemometrics Methods" LINK

"Non-Targeted Detection of Adulterants in Almond Powder Using Spectroscopic Techniques Combined with Chemometrics." LINK


Environment NIR-Spectroscopy Application

"Mobile Proximal Sensing with Visible and Near Infrared Spectroscopy for Digital Soil Mapping" LINK


Agriculture NIR-Spectroscopy Usage

"Imaging Techniques for Chicken Products Detection" LINK

"Usage of visual and near-infrared spectroscopy to predict soil properties in forest stands" LINK

"NUTRIENT CONTENT OF SOYBEAN MEAL FROM DIFFERENT ORIGINS BASED ON NEAR INFRARED REFLECTANCE SPECTROSCOPY" LINK

"Robustness of visible near-infrared and mid-infrared spectroscopic models to changes in the quantity and quality of crop residues in soil" LINK

"Use of leaf hyperspectral data and different regression models to estimate photosynthetic parameters (Vcmax and Jmax) in three different row crops" LINK

"Rapid and direct detection of small microplastics in aquatic samples by a new near infrared hyperspectral imaging (NIR-HSI) method" LINK


Horticulture NIR-Spectroscopy Applications

"Prediction of Soluble Solids Content During Storage of Apples with Different Maturity Based on VIS/NIR Spectroscopy" LINK

"A new spectral pretreatment method for detecting soluble solids content of pears using Vis/NIR spectroscopy" LINK

"Research on the Performance of Juicy Peach Sugar Content Detection Model Based on Near Infrared Spectroscopy" LINK


Forestry and Wood Industry NIR Usage

"The Effect of Construction and Demolition Waste Plastic Fractions on Wood-Polymer Composite Properties" LINK


Food & Feed Industry NIR Usage

"Non-destructive Assessment of Flesh Firmness and Dietary Antioxidants of Greenhouse-grown Tomato (Solanum lycopersicum L.) at Different Fruit Maturity Stages" LINK

"Comparative analysis of rice seed viability detection based on different spectral bands" LINK

"Detection of chocolate powder adulteration with peanut using near-infrared hyperspectral imaging and Multivariate Curve Resolution" LINK


NIR Calibration-Model Services

Spettroscopia e Chemiometria Weekly News 34, 2020 | NIRS NIR Spettroscopia MachineLearning analisi chimica Spettrale Spettrometro Chem IoT Sensore Attrezzatura analitica Laboratorio analisi prova qualità Analysesystem QualityControl LINK

This week's NIR news Weekly is sponsored by Your-Company-Name-Here - NIR-spectrometers. Check out their product page ... link

Get the Chemometrics and Spectroscopy News in real time on Twitter @ CalibModel and follow us.


Near-Infrared Spectroscopy (NIRS)

"Modelos NIRS para as características químicas da madeira de Eucalyptus benthamii Maiden & Cambage" LINK

"Application of in situ near infra-red spectroscopy (NIRS) for monitoring biopharmaceuticals production by cell cultures" LINK

"Using the NIRS for analyzes of soil clay content" LINK

"Determination of compost maturity using near infrared spectroscopy (NIRS)" LINK

"Screening Risk Assessment of Agricultural Areas under a High Level of Anthropopressure Based on Chemical Indexes and VIS-NIR Spectroscopy" LINK

"… an algorithm for processing Red Green Blue (RGB) images for the estimation of crude protein in grasses vs Near Infrared Reflectance Spectroscopy Technology (NIRS …" LINK

"Monitoring of cheese maturation using near infrared-hyperspectral imaging (NIR-HIS)" LINK

"Selection of sugarcane clones via multivariate models using near-infrared (NIR) spectroscopy data" LINK


Infrared Spectroscopy (IR) and Near-Infrared Spectroscopy (NIR)

"Rapid and simultaneous analysis of multiple wine quality indicators through near-infrared spectroscopy with twice optimization for wavelength model" LINK

"Manuka honey adulteration detection based on near-infrared spectroscopy combined with aquaphotomics" LINK

" Identification of Marine Fish Taxa by Linear Discriminant Analysis of Reflection Spectra in the Near-Infrared Region" LINK

"Assessment of Intact Macadamia Nut Internal Defects Using Near-Infrared Spectroscopy" LINK

"Rational design of near-infrared platinum(ii)-acetylide conjugated polymers for photoacoustic imaging-guided synergistic phototherapy under 808 nm irradiation." LINK

"Classification of fish species from different ecosystems using the near infrared diffuse reflectance spectra of otoliths" LINK

"Three new Amazonian species of Myrcia sect. Myrcia (Myrtaceae) based on morphology and near-infrared spectroscopy" LINK

"Rapid Online Determination of Feed Concentration in Nitroguanidine Spray Drying Process by Near Infrared Spectroscopy" LINK


Raman Spectroscopy

"Monitoring the Caustic Dissolution of Aluminum Alloy in a Radiochemical Hot Cell Using Raman Spectroscopy" LINK


Hyperspectral Imaging (HSI)

"Hyperspectral Imaging and Deep Learning for Food Safety Assessment" LINK


Chemometrics and Machine Learning

"Rapid and Nondestructive Freshness Determination of Tilapia Fillets by a Portable Near-Infrared Spectrometer Combined with Chemometrics Methods" LINK

"Non-Targeted Detection of Adulterants in Almond Powder Using Spectroscopic Techniques Combined with Chemometrics." LINK


Environment NIR-Spectroscopy Application

"Mobile Proximal Sensing with Visible and Near Infrared Spectroscopy for Digital Soil Mapping" LINK


Agriculture NIR-Spectroscopy Usage

"Imaging Techniques for Chicken Products Detection" LINK

"Usage of visual and near-infrared spectroscopy to predict soil properties in forest stands" LINK

"NUTRIENT CONTENT OF SOYBEAN MEAL FROM DIFFERENT ORIGINS BASED ON NEAR INFRARED REFLECTANCE SPECTROSCOPY" LINK

"Robustness of visible near-infrared and mid-infrared spectroscopic models to changes in the quantity and quality of crop residues in soil" LINK

"Use of leaf hyperspectral data and different regression models to estimate photosynthetic parameters (Vcmax and Jmax) in three different row crops" LINK

"Rapid and direct detection of small microplastics in aquatic samples by a new near infrared hyperspectral imaging (NIR-HSI) method" LINK


Horticulture NIR-Spectroscopy Applications

"Prediction of Soluble Solids Content During Storage of Apples with Different Maturity Based on VIS/NIR Spectroscopy" LINK

"A new spectral pretreatment method for detecting soluble solids content of pears using Vis/NIR spectroscopy" LINK

"Research on the Performance of Juicy Peach Sugar Content Detection Model Based on Near Infrared Spectroscopy" LINK


Forestry and Wood Industry NIR Usage

"The Effect of Construction and Demolition Waste Plastic Fractions on Wood-Polymer Composite Properties" LINK


Food & Feed Industry NIR Usage

"Non-destructive Assessment of Flesh Firmness and Dietary Antioxidants of Greenhouse-grown Tomato (Solanum lycopersicum L.) at Different Fruit Maturity Stages" LINK

"Comparative analysis of rice seed viability detection based on different spectral bands" LINK

"Detection of chocolate powder adulteration with peanut using near-infrared hyperspectral imaging and Multivariate Curve Resolution" LINK


Spectroscopy and Chemometrics News Weekly #33, 2020Spektroskopie und Chemometrie Neuigkeiten Wöchentlich #33, 2020Spettroscopia e Chemiometria Weekly News #33, 2020

NIR Calibration-Model Services

Spectroscopy and Chemometrics News Weekly 32, 2020 | NIRS NIR Spectroscopy MachineLearning Spectrometer Spectrometric Analytical Chemistry Chemical Analysis Lab Labs Laboratories Laboratory Software IoT Sensors QA QC Testing Quality LINK

Spektroskopie und Chemometrie Neuigkeiten Wöchentlich 32, 2020 | NIRS NIR Spektroskopie MachineLearning Spektrometer IoT Sensor Nahinfrarot Chemie Analytik Analysengeräte Analysentechnik Analysemethode Nahinfrarotspektroskopie Laboranalyse LINK

Spettroscopia e Chemiometria Weekly News 32, 2020 | NIRS NIR Spettroscopia MachineLearning analisi chimica Spettrale Spettrometro Chem IoT Sensore Attrezzatura analitica Laboratorio analisi prova qualità Analysesystem QualityControl LINK

This week's NIR news Weekly is sponsored by Your-Company-Name-Here - NIR-spectrometers. Check out their product page ... link

Get the Chemometrics and Spectroscopy News in real time on Twitter @ CalibModel and follow us.


Near-Infrared Spectroscopy (NIRS)

"Integrated soluble solid and nitrate content assessment of spinach plants using portable NIRS sensors along the supply chain" LINK

"Evaluation of Near Infrared Spectroscopy (NIRS) and Remote Sensing (RS) for Estimating Pasture Quality in Mediterranean Montado Ecosystem" LINK

"Evaluation of Homogeneity in Drug Seizures Using Near-Infrared (NIR) Hyperspectral Imaging and Principal Component Analysis (PCA)"LINK

"FT-NIRS Coupled with PLS Regression as a Complement to HPLC Routine Analysis of Caffeine in Tea Samples" Foods LINK


Infrared Spectroscopy (IR) and Near-Infrared Spectroscopy (NIR)

"Model based optimization of transflection near infrared spectroscopy as a process analytical tool in a continuous flash pasteurizer" LINK

"EXPRESS: Monitoring Polyurethane Foaming Reactions Using Near-Infrared Hyperspectral Imaging" LINK

"Near-infrared spectroscopy for monitoring free jejunal flap." LINK

"Real-Time and Online Inspection of Multiple Pork Quality Parameters Using Dual-Band Visible/N ear-Infrared Spectroscopy" LINK

"An approach to quantify natural durability of Eucalyptus bosistoana by near infrared spectroscopy for genetic selection" LINK

"Rapid detection of green pea adulteration in ground pistachio nuts using near and mid-infrared spectroscopy" LINK

"Non‐invasive quality analysis of thawed tuna using near infrared spectroscopy with baseline correction" LINK


Raman Spectroscopy

"Low-Content Quantitation in Entecavir Tablets Using 1064 nm Raman Spectroscopy" LINK


Hyperspectral Imaging (HSI)

"Detecting defects on cheese using hyperspectral image analysisLINK

"Non-destructive discrimination of the variety of sweet maize seeds based on hyperspectral image coupled with wavelength selection algorithm" LINK

"Hyperspectral Imaging from a Multipurpose Floating Platform to Estimate Chlorophyll-a Concentrations in Irrigation Pond Water" Remote Sensing LINK

"Alfalfa Yield Prediction Using UAV-Based Hyperspectral Imagery and Ensemble Learning" LINK


Chemometrics and Machine Learning

"Maintaining the predictive abilities of near-infrared spectroscopy models for the determination of multi-parameters in White Paeony Root" LINK

"Machine Learning Modeling of Wine Sensory Profiles and Color of Vertical Vintages of Pinot Noir Based on Chemical Fingerprinting, Weather and Management Data" Sensors LINK

"Authentication of the Geographical Origin of “Vallerano” Chestnut by Near Infrared Spectroscopy Coupled with Chemometrics" LINK


Agriculture NIR-Spectroscopy Usage

"Relationship between chemical composition and standardized ileal digestible amino acid contents of corn grain in broiler chickens" LINK

"NIR spectroscopy and management of bioactive components, antioxidant activity, and macronutrients in fruits" LINK

"Determination of mechanical properties of whey protein films during accelerated aging: Application of FTIR profiles and chemometric tools" LINK

"A portable IoT NIR spectroscopic system to analyze the quality of dairy farm forage" LINK

"Exploring Relevant Wavelength Regions for Estimating Soil Total Carbon Contents of Rice Fields in Madagascar from Vis-NIR Spectra with Sequential Application of …" LINK

"Applied Sciences, Vol. 10, Pages 4345: Observation of Potential Contaminants in Processed Biomass Using Fourier Transform Infrared Spectroscopy" LINK

"Animals, Vol. 10, Pages 1095: Comparison of Fatty Acid Proportions Determined by Mid-Infrared Spectroscopy and Gas Chromatography in Bulk and Individual Milk Samples" LINK

"Manipulation of Fruit Dry Matter via Seasonal Pruning and Its Relationship to dAnjou Pear Yield and Fruit Quality" Agronomy LINK


Forestry and Wood Industry NIR Usage

"The Effect of Construction and Demolition Waste Plastic Fractions on Wood-Polymer Composite Properties" LINK


Food & Feed Industry NIR Usage

"Analysis of sorghum content in corn–sorghum flour bioethanol feedstock by near infrared spectroscopy" LINK

"Quantitative detection of fatty acid value during storage of wheat flour based on a portable near-infrared (NIR) spectroscopy system" LINK

"Integration of spectra and image features of Vis/NIR hyperspectral imaging for prediction of deoxynivalenol contamination in whole wheat flour" LINK

"Ongoing Research on Microgreens: Nutritional Properties, Shelf-Life, Sustainable Production, Innovative Growing and Processing Approaches" Foods LINK


Pharma Industry NIR Usage

"Direct Catalytic Fuel Cell Device Coupled to Chemometric Methods to Detect Organic Compounds of Pharmaceutical and Biomedical Interest" Sensors LINK


Laboratory and NIR-Spectroscopy

"Application of infrared microscopy and alternating least squares to the forensic analysis of automotive paint chips" LINK


Other

"Phenotypic plasticity and nonstructural carbohydrates in annual growth rings of the australian red cedar clones in contrasting enviroments" LINK


NIR-Predictor – Manual


NIR-Predictor – Manual

Predicting Spectra

It’s easy to use with NIR-Predictor,
just drag & drop your data for getting the prediction results.

It supports an automatic file format detection.
So you don’t need to specify the instrument type and settings! See the list of supported formats and NIR Vendors: NIR-Predictor supported Spectral Data File Formats

Use the included data to checkout how it feels:

  1. Open the demo Spectra folder by using the Menu > Open Demo Spectra or press F8.
    There are files with spectra from different Vendors.
  2. Drag & drop a spectra file onto the NIR-Predictor window (or press Ctrl+O as for ’Open some files).
  3. The spectra will be
    • loaded
    • pre-processed
    • predicted and
    • reported

Note:
All the steps are fully automatic.
All calibrations that are compatible with the spectra, will produce prediction results in one go.
To select specific calibrations choose the Application. Where the ” ” empty means use all the calibrations.
To define a Application read more in chapter “Applications”

Hint:
To get access to Statistics of Predictions and Reports use the Menu > Show more/less (Ctrl+M) or you can simply resize the window. Here you can also re-do the Analyze step manually with changed inputs (e.g. Result Ordering).


Creating your own Calibrations

How it works – step by step

  1. You have measured your samples with you NIR-Instrument Software.
    And got the Lab-values of these samples.

    samples
    -> measured NIR-spectra
    -> Lab-references analytics

  2. Now you need to combine these data.

    NIR-spectra + Lab-references
    -> PropertiesBySamples

    Note: If you combined these data already in your NIR software used,
    and you can export it as a JCAMP-DX file then use
    Menu > Create Request File .req ... (F2)
    and read the “Help.html” and NIR-Predictor JCAMP.
    Else proceed as below.

    The NIR-Predictor provides tooling for that:

    Menu > Create Properties File... (F6)

    Select the folder with your NIR spectra measured for an application.
    NIR-Predictor creates a customized Properties file template for that data to enter the Lab values.

    Note: You don’t need to specify your instrument or vendor or an application. It’s all done automatically. And also the sample spectra are detected and grouped automatically!

  3. Use your favorite editor or spreadsheet program to enter and copy&paste
    the Lab-references Values into the columns “Prop1”, “Prop2” etc. and save the file.
  4. A final check of your entered data is done by NIR-Predictor,
    to make sure your data ist complete and all is fine.

    Menu > Create Calibration Request... (F7)

    Select the folder with the filled file.
    A CalibrationRequest.zip is created with the necessary data
    if enougth diverse Lab values are entered.

  5. Email the CalibrationRequest.zip file
    to info@CalibrationModel.com to develop the calibrations.
  6. When your calibrations are ready, you will receive an email with a link
    to the CalibrationModel WebShop where
    you can purchase and download the calibration files,
    that work with our free NIR-Predictor software without internet access.

    Note: Your sent NIR data is deleted after processing.
    We do not collect your NIR data!

Note: Further details can be found under “Create Properties File” and “Create Calibration Request”.


Configure the Calibrations for prediction usage

Configuration:

  1. in NIR-Predictor : Menu > Open Calibrations (F9)
  2. an explorer window is opened where the calibrations are located
  3. create a folder for your application, choose a name
  4. copy the calibration file(s) (*.cm) into that folder
  5. in NIR-Predictor : Menu > Search and load Applications (F4)

Usage:

  1. in NIR-Predictor : open the Application drop down list, and select your application by name
  2. if all is fine, the calibration file is valid and not expired, it shows : Calibration “1 valid calibation”
  3. the NIR-Predictor is now ready to predict
  4. to switch the application, goto 6.

Applications

The Application concept allows to group multiple Calibrations together for an Application. By selecting an Application before prediction, only the Calibrations belonging to the Application will be used for Prediction. In the Demo Data this is used to have multiple spectrometer as Application. This can be used easily as e.g. as Application “Meat Products” containing Fat and Moisture Calibration.

To create an Application, create a folder with the Application’s name inside the Calibrations folder, and move/copy all the Calibrations files to this Application folder. To remove a Calibration from the Application, remove the Calibration file from the Application folder.

After creating an new Application folder, press menu Search and load Applications (F4) to update the NIR-Predictor dialog where the Application can be selected via the dropdown list. You don’t need to close the NIR-Predictor.

After moving Calibration files around, press menu Search and load Calibrations (F5) to update the NIR-Predictor dialog.

The use-all case

In the NIR-Predictor dialog where the Application can be selected via the dropdown list, the empty "" name means that all (yes all) valid Calibrations will be used for prediction.

Note: The Prediction Report will contain only results from spectral compatible Calibrations with the given spectra. That allows to automatically handle the multi vendor NIR instrument usage.


Prediction Result Report

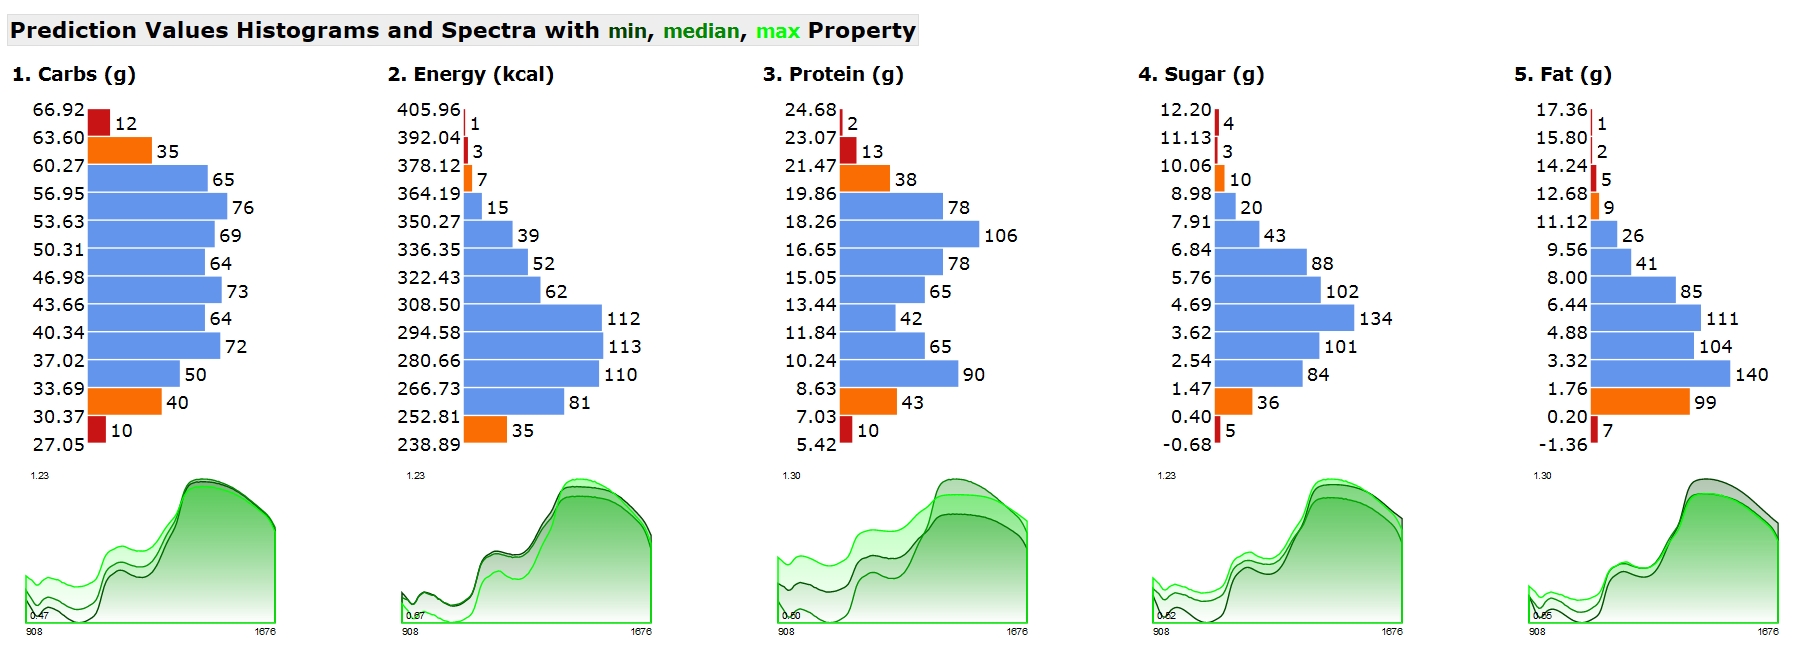
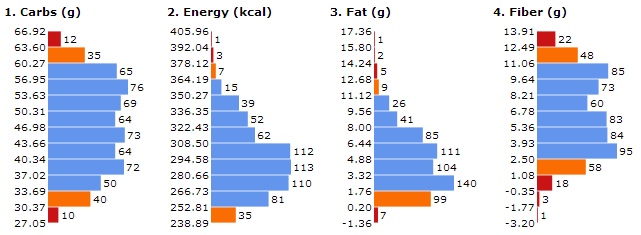
Histograms of Prediction Values per Property

Shows the distribution of the predicted results per calibration. The histogram range contains the range of the calibrated property and includes the predicted results.

The histogram bar (bin) color is defined as follow:

  • blue : all predictions inside calibration range.
  • red : all predictions outside calibration range.
  • orange : some overlaps with calibration range.
    So not all spectra in a orange bin are outside calibration range.
Histograms

Note: Predicted values are always shown in Histogram table and Prediction Value List table, even if the spectrum does not fit into model (spectrum different to model, aka Residual Outlier) shown as Out = X.

Note: Old browsers like Microsoft Internet Explorer 11 don’t support the grafics for Histogram charts. Use an current browser like Firefox or Chrome or Edge.

Note: If your browser opens the report too slow, try to deactivate some browser plugins, because they can filter what you look at and some add-ons are really slow.

Spectra Plot Thumbnail on the Prediction Report

Visualizes the min,median,max spectrum of the spectra dropped as files on the NIR-Predictor. This gives a minimal and good spectral overview of the predicted property results.

  • Spectra Plot color legend: min,median,max spectrum by predicted property or if no calibration is available by spectral intensity.
  • The min,median,max is determined from the predicted properties or if not available from the intensity of the spectra.
  • Beside the histogram of the predicted properties, where the distribution can be seen, the spectra shown are the ones from min,median,max predicted property.
  • This gives a minimal and good spectral overview of the predicted property results.
  • The “Spectral Range” and number of datapoints is shown in the Prediction Report Header below the listed spectra files.
  • To zoom the spectra plot a little, zoom the report in the browser (hold ctrl + mouse wheel, or pinch on touch screen).
  • The spectra plots and histograms are stored with the report and can be archived.

Note

  • Note that the spectra are shown in the raw values that are loaded, they are not shown pre-processed as the calibration model uses them to make the prediction.
  • Note that the median property spectrum is the median from the predicted property pobulation and not the “median” of the calibration property range.
  • Note that in the multi calibration prediction case, the spectra are selected for each property based on the related predicted property values and so the spectra plots shows typical different spectra.
Spectra Plot

Outlier Detection

To safeguard the prediction results, outliers are automatically checked for each individual prediction. This is based on limits that are determined when creating the calibration with the base data. Thus, a strange spectral measurement can be detected and signaled as an outlier even without base data only by means of the calibration and the NIR predictor. A prediction result with outlier warning is to be distrusted. How the various outlier tests are interpreted and how to avoid them in practice is described here.

The spectrum is an outlier to the model, if the spectrum is not similar with the spectra and lab-values the model is built with.

This legend is shown on each NIR-Predictor prediction report below the results:

Outlier (Out) Symbol Description

  • “X” : spectrum does not fit into model (spectrum different to model)
  • “O” : spectrum is wide outside model center (spectrum similar to model but far away)
  • “=” : prediction is outside upper or lower range of model (property outside model range)
  • “-” : spectrum is incompatible to calibration

Note: A prediction result with outlier warning is to be distrusted.

There are 3 outlier cases (X, O, =) and the incompatible data case “-”.

  • The bad case is “X”
  • the medium case is “O”
  • and the soft case is “=”.

The technical names in literature correspond to:

  • “X” : Spectral Residual Outlier
  • “O” : Leverage Outlier
  • “=” : Property Range Outlier

These 3 outlier cases can appear in combinations, like “XO=” or “XO” or “O=” or “X=”. The more outlier marker are shown the more likely the spectrum is an Outlier.

The default setting in NIR-Predictor Menu > “Report with Simplified Outlier Symbols”

  • is ON, that will show only the worst case instead of all combinations to have a simplified minimal information.
  • if OFF, that will show the combinations (e.g. “XO=” or “XO” or “O=” or “X=”), which is more informative for analyzing problem cases.

Some hints to avoid these Outliers:

  • “X” : spectrum does not fit into model (spectrum different to model)
    Check if the spectrum is noise only, or has no proper signal. That can happen when measured past the sample or measured into the air or at a different substance. If you have multiple NIR instruments of the same type, use spectra measured with different instruments for the calibration.
  • “O” : spectrum is wide outside model center (spectrum similar to model but far away) Sample temperature has an effect on NIR spectra shape, use spectra measured at different (typical use) temperatures (sample temperature, instrument temperature).
  • “=” : prediction is outside upper or lower range of model (property outside model range)
    Use more spectra for the calibration in the Lab value region where your special interest is. If the predicted value is only a little bit out of the calibration range, it can be Ok. Add these spectra to the calibration spectra (with the Lab values), to extend the prediction range of the calibration.
  • “-” : spectrum is incompatible to calibration
    The spectra (from the NIR instrument) has a different wavelength range or a different resolution than the spectra used for calibration. Check Instrument settings (wavelength range, resolution)

Result Ordering

To change the ordering, a drop-down-box is located below the Analyze button. If there is an analysis from the current session, and the Result Ordering is changed, the data is re-Analyzed and reported with the new Result Ordering setting. That allows to compare the different orderings. The Result Ordering is listed in the Prediction Report above the Prediction Value List and stored in the settings.

The order/sorting of the prediction results of the spectra can be defined:

  • GivenOrder (default) the given order of the spectra from file select dialog or drag&drop

*) sorted : ascending sort

  • Date_Name sorted by Date (if any) and then by Name
  • Name_Date sorted by Name and then by Date
  • Date_NamesWithNumbers sorted by Date (if any) and then by Name with number logic
  • NamesWithNumbers_Date sorted by Name with number logic (e.g. “ABC1” is before “ABC002” ) and then by Date

*) as above but sorted Rev : reverse sort = descending sort

  • Rev_Date_Name
  • Rev_Name_Date
  • Rev_Date_NamesWithNumbers
  • Rev_NamesWithNumbers_Date

E.g. with reverse sort by Rev_Date_Name, the newest spectra appear on top.

Depending on how many calibrations are used the result table is getting broader. To print the report (e.g. to Adobe PDF, FreePDF or Microsoft XPS), sometimes the landscape format is shorter in number of pages or in portrait a scale of 80% fits nicely. Or try another internet browser (Mozilla Firefox, Google Chrome, Microsoft Edge, …) to print the report and set the browser as your default browser so it will be opened by default.

Archiving Reports

Each report is contained in one file only, including the grafics. To save storage space the report file folder can be compressed to a zip file (.zip, .7z).


Enter lab values to NIR spectra

Entering the laboratory reference values for NIR calibrations

We have developed specialized tools into NIR-Predictor to combine the NIR and Lab data is a sample-based safe manner.

The main target is to improve Data Quality during the step of combining of the Lab data and the NIR data, because to model a good reliable calibration the data that build the base needs to be of high quality.

It also simplifies to enter the lab values manually to the corresponding NIR data, because of automatically grouping repeated NIR measurements of the same sample, so the lab values can be entered sample based and not by spectrum.

It helps to avoid false reference data, because of the broken relation of NIR spectra and reference values, data entry on the wrong position in the table.

And Helps to detect errors of duplicated or multiple copies of spectra files, and checks for inconsistencies in Date-Time and Sample-Naming. It also checks for missing values.

That all increases the Data Quality for the next step of Calibration Development, and makes data entry a less time consuming and less risky work.

How it works

  1. Menu > Create Properties File... (F6) select the folder with your NIR spectra measured for an application. NIR-Predictor creates a Properties file template for that data : PropertiesBySamples.csv.txt
  2. Use your favorite editor or spreadsheet program to enter and copy&paste the Lab Values into the columns and save the file.
  3. Menu > Create Calibration Request... (F7) select the folder with the filled file for a last check and a Calibration Request file is created with the needed data as a single zip file.
  4. Email the Calibration Request file to info@CalibrationModel.com to develop the calibrations.

Ok that is it, the NIR-Predictor guides you through the steps needed. And if you need to know more details, the Chapter “Create Properties File” is for you.

Create Properties File

Note:

  • If you have (exported) JCAMP-DX files containing the Lab-Values, you don’t need to do this step.
    You can send the JCAMP file with your Request (.req) file directly to the calibration service at info@CalibrationModel.com.
  • If your JCAMP-DX files does NOT contain Lab-Values, this is a way to go.

For calibrating the spectra to the lab-values you need to assign the lab-values to the spectra. The easiest way is to have a table where each spectrum (row) is linked to multiple lab-values (columns). This function Create Properties File build such a table for the selected spectra folder automatically!

This table is stored in the file PropertiesBySamples.csv.txt. This can be created for any spectra folder you like. The file extension is .csv.txt to make it easy to edit in a text editor and also in a spreadsheet (excel). The columns are standard TAB separated.

The file header line contains :

Sample Replicates Names Prop1 Prop2 Prop3 DateFirst DateLast Hashes

Where Name and Date describes the spectrum.

Prop1, Prop2, Prop3 are the place to enter the Lab Reference Concentrations properties corresponding to each spectrum. It can be extended to Prop4, Prop5, … etc. Of course you can enter real word names like “Fat (%)” instead of “Prop1”. It’s recommended to put the measurement unit beside the name.

Replicates is the number of replicated or repeated spectra of a sample that is grouped together in the Sample based property file. Sample name and the DateFirst / DateLast between the sample spectra are measured.

Date format is ISO-8601. Missing Dates are 0002-02-02T00:00:00.0000000.

If the file PropertiesBySamples.csv.txt already exist in the selected folder, the user will be notified (it will not be overwritten, because the file may contain user entered Lab-values). The Lab Reference Concentrations values are initialized to 0 (zero) and needed to be changed.

Note: 0 is not interpreted as missing value! If you have a 0 concentration value, put in 0 or 0.0 .

The entry of properties is as easy as possible, because it’s organized by Sample (and not by Spectra), so it’s like your Lab-Value Table that is sample based. The sample rows are sorted in a special way by Sample name. Sorting by Date or alphabetically by Sample can done easily in a spreadsheet program.

Note: when coping lab values to the samples make sure they correspond, so that there are no gaps and the sorting is the same.

The Spectra (rows) are initially sorted by name (and date) to have the replicates/repeats together. You can sort for your convenience in a spreadsheet program.

Enter the Lab Reference Concentrations to the spectra/sample.

Enter the Lab-Values in spreadsheet (e.g. Excel) or a text editor (e.g. Notepad++). If done, use the next menu Create Calibration Request.

Hints: Data handling:

  • The NIR-Predictor creates the PropertiesBySamples.csv.txt once, after that the user is responsible for its content. That means NIR-Predictor does not change this file anymore.
  • You can remove entire rows (spectra) in the property file. You don’t need to remove the spectra files. The NIR-Predictor is aware of the relation, the PropertiesBySamples.csv.txt defines what will be calibrated.
  • How to add more spectra files?

    The additional spectra can be handled in a separate folder, create the property file and copy the spectra to the other folder and copy/merge the property files together in your editor or spreadsheet.

    Or

    Copy the spectra into the folder, rename the PropertiesBySamples.csv.txt to e.g. “PropertiesBySamples-Part1.csv.txt” and use Create Properties File to create a new PropertiesBySamples.csv.txt with all the spectra. You can copy/merge the content of the Properties files together in your editor or spreadsheet.

  • What happens with possible duplicate rows? It does no harm to the Calibration because we do an exact checking and data cleaning in the calibration process.
  • What happens to duplicate spectra names? The spectra names are not relevant for the calibration process. The spectra names are helpful to assign the lab-values to the corresponding spectrum entry. That’s why the table is initially sorted by name. The spectra names can be edited by the user.

Create Calibration Request

The menu function Create Calibration Request packs a created Properties file (see “Create Properties File”) and it’s linked spectra files in a compressed ZIP file for sending to the CalibrationModel.com Service.

Please note that the number of measured quantitative samples need to be at least 60 . That means you need at least 60 different spectra (not counting the replicate/repeated measurements).

It shows additional property information about the data you have entered, like – the property type (Quantitative) – it’s range (min – max) and – the number of unique values and – if the Lab-values are enough diverse to get calibrated.

First select the folder with the PropertiesBySamples.csv.txt and measured spectra files of samples you have Lab-values. The data is checked and you get notified what is missing or might be wrong. If something needs to be changed, edit the PropertiesBySamples.csv.txt and do Create Calibration Request again. Your last selected folder is remembered, so you can press return in the folder selection dialog.

Hint: The keyboard shortcuts for redoing it after you edited some entries is : F7 Return – that allows you to get the property information quickly.

Hint: If you open the PropertiesBySamples.csv.txt in a spreadsheet program, you can create Histogram plots of the entered Lab-values, to see in which range are to less samples measurements.

When all is fine

When all is fine the “CalibrationRequest.zip” file is created for that data.

The ZIP file contains:

  • your PropertiesBySamples.csv.txt
  • your personal REQuest file for your computer system, that looks like
    e.g. “337dcdc06b2d6dfb0b5c4bba578642312edf2ae84d909281624d7e26283e8b07 WIN-GB0PB48GSK4.req”
  • the spectra data files

Note: If the CalibrationRequest.zip file is already created and you change the PropertiesBySamples.csv.txt make sure to delete the old CalibrationRequest.zip file first! In the dialog it states if it was successfully created or NOT because it already exist. So you are always on the safe side.

Note: CalibrationRequest.zip file name contains the property names to know what would be calibrated and at the end an identification number for referencing the file. E.g. “CalibrationRequest ‘Prop1’ – ‘Prop2’ h31T3wOH.zip”


Program Settings

  • The users program settings are stored in UserSettings.json
  • The program counters are stored in GlobalCounters.json

Further References