Do you know the effect that you prefer to try out their favorite data pretreatments in combination and often try the same wavelength selections based spectra of the visualized?
You try as six to ten combinations until one of them selects his favorite calibration model, to then continue to optimize. Since then suddenly fall to
outliers, because it goes in depth, so is familiar with the data, we know now the spectra of numbers of outliers and is familiar with the extreme values.
Now, the focus is on the
major components (principal components, Latent Variables, factors) and makes sure not to over-fit and under-fit not to. The whole takes a few hours and finally one is content with the model found.
So
what would happen if you all in the beginning tried variants found outliers removed and re-evaluated and compared? The results would be better than that of the previous model choice? One does not try out? Because it is cumbersome and takes hours again?
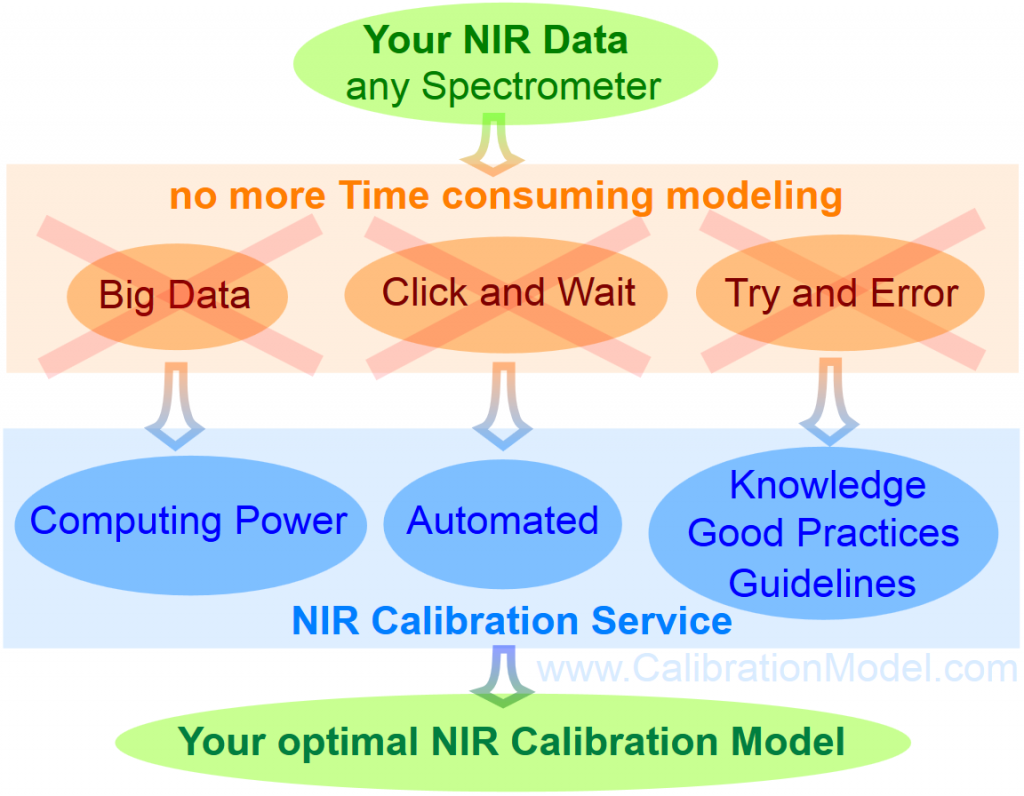
We have developed a
software which simplifies this so that also the number of model variations can be increased as desired. The variants generation is automated with an intelligent control system, as well as the optimization and comparing the models and finally the final selection of the best calibration model.
Our software includes all the usual known
data pretreatment methods (data pre-processing) and can combine them useful. Since many Preteatments are directly dependent on the wavelength selection, such as the normalization the determined within a wavelength range of the scaling factors to normalize the spectra so that
pretreatments with the wavelength ranges may be
combined. So a variety of settings sensible model comes together that are all calculated and optimized.
For the automatic selection of the relevant wavelength ranges, different methods are used, which are based on the spectral intensities. Thus, for example, regions with
total absorption is not used, and often interfering water bands removed or retained.
Over all the calculated model variations as a
summary outlier analysis can be made. Are there any new outliers (hidden outlier) discovered, all previous models can be automatically recalculated, optimized and compared without these outliers.
From this great number of calculated models with the statistical quality reviews (prediction performance) the optimum calibration can now be selected. For this purpose, not simply sorting by the prediction error (prediction error, SEP RMSEP) or the coefficient of determination (coefficient of determination r
2), but by several statistical and test values are used jointly toward the final assessment of optimal calibration.
Thus we have created a platform that allows the
highly automated work what a man can never do with a commercial software.
We therefore offer the
largest number of
matched to your application problem modeling calculations and choose the best calibration for you!
This means that our results are faster, more accurate, robust and objective basis (person independent) and quite easy for you to apply.
You have the
full control of the models supplied by us, because we provide a clearly structured and detailed blueprint of the complete calibration, with all settings and parameters, with all necessary statistical characteristics and graphics.
Using this
blueprint, you can adjust the quantitative calibration model itself in the software you use, understand and compare. You have everything under control form model creation, model validation and model refinement.
Your
privacy is very important to us. The NIR data that you briefly provide us for the custom calibration development will remain of course your property. Your NIR data will be deleted after the job with us.
Start Calibrate
Interested, then do not hesitate to
contact us.
Kennen Sie den Effekt, dass Sie bevorzugt ihre Lieblings-Datenvorbehandlungen in Kombination durchprobieren und oft die gleichen Wellenlängen-Selektionen anhand der visualisierten Spektren ausprobieren?
Man probiert z.B. sechs bis zehn Kombinationen aus, bis man davon sein favorisiertes Kalibrationsmodell auswählt, um es dann weiter zu optimieren. Da fallen dann plötzlich Ausreisser (Outlier) auf, weil man in die Tiefe geht, also mit den Daten vertraut ist, man kennt mittlerweile die Spektren-Nummern der
Ausreisser und ist mit den Extremwerten vertraut.
Jetzt fokussiert man sich auf die
Hauptkomponenten (Principal Components, Latent Variables, Faktoren) und achtet darauf nicht zu über-fitten und nicht zu unter-fitten. Das ganze dauert ein paar Stunden und schliesslich begnügt man sich mit dem gefundenen Modell.
Was wäre nun, wenn man in all den zu Beginn ausprobierten Varianten, die gefundenen Ausreisser entfernt und nochmals berechnet und vergleicht? Wären die Ergebnisse besser als die von der bisherigen Modell Wahl? Man probiert es nicht aus? Weil es mühsam ist und wieder Stunden dauert?
Wir haben eine Software entwickelt die
dies so vereinfacht, dass auch die Anzahl der Modell Variationen beliebig erhöht werden kann. Die Varianten Erzeugung läuft automatisiert mit einem intelligenten Regelsystem, so auch die Optimierung und das Vergleichen der Modelle und schliesslich die finale Auswahl des Besten Kalibrations Modell.
Unsere Software beinhaltet alle üblichen bekannten
Datenvorbehandlungs Methoden (Preteatments) und kann diese sinnvoll kombinieren. Da viele Preteatments direkt abhängig sind von der Wellenlängen Selektion, so z.B. die Normalisierungen die innerhalb eines Wellenlängen-Bereiches die Skalierungsfaktoren ermittelt, um die Spektren damit zu normieren, werden die
Pretreatments mit dem Wellenlängen-Bereichen kombiniert. So kommt eine Vielzahl von sinnvollen Modell Einstellungen zusammen die alle berechnet und optimiert werden.
Für die automatische Auswahl der relevanten Wellenlängen Bereiche kommen verschiedene Methoden zum Einsatz, die sich an den Spektren Intensitäten orientieren. So werden z.B. Bereiche mit
Totalabsorption nicht verwendet, oftmals störende Wasserbanden entfernt oder beibehalten.
Über all die berechneten Modell Variationen können so
zusammenfassende Outlier Analysen gemacht werden. Werden durch die gefahrenen Versuche neue Outlier (Hidden Outlier) entdeckt, können alle bisherigen Modelle automatisch ohne diese Ausreisser nachberechnet, optimiert und verglichen werden.
Aus dieser Vielzahl berechneter Modelle mit deren Statistischen Güte Bewertungen (Prediction Performance) kann nun die
optimale Kalibration ausgewählt werden. Dazu wird nicht einfach nach dem Vorhersage Fehler (Prediction Error, SEP, RMSEP) oder nach dem Bestimmtheitsmaß (Coefficient of Determination r
2) sortiert, sondern mehrere Statistik- und Testwerte gemeinsam zur umfänglichen Beurteilung der optimalen Kalibration herangezogen.
Somit haben wir eine Plattform geschaffen, die es ermöglicht
hochgradig automatisiert das zu tun, was ein Mensch niemals mit einer handelsüblichen Software tun kann.
Wir bieten damit die
grösste Anzahl auf Ihr Applikations-Problem
angepasste Modellierungs-Berechnungen und wählen die beste Kalibration für Sie aus!
Das heisst, unsere Ergebnisse sind schneller, genauer, robuster und objektiv ausgewählt (Personen unabhängig) und für Sie ganz einfach anzuwenden.
Die
Kontrolle über die von uns gelieferten Modelle haben Sie vollumfänglich, denn wir liefern einen klar strukturierten und detaillierten Bauplan der kompletten Kalibration, mit allen Einstellungen und Parametern, mit allen notwendigen Statistischen Kenngrössen und Grafiken.
Anhand dieses
Bauplans können Sie das quantitative Kalibrations Modell selbst in der von Ihnen verwendeten Software nachstellen, nachvollziehen und vergleichen. Sie haben so alles im Griff, für die Modell-Validierung und die Modellpflege.
Der
Datenschutz ist uns sehr wichtig. Die NIR Daten, die Sie uns für die Kalibrations-Erstellung kurzzeitig zu Verfügung stellen bleiben selbstverständlich Ihr Eigentum. Ihre NIR Daten werden nach Abschluss des Auftrags bei uns gelöscht.
Start Calibrate
Interessiert, dann zögern Sie nicht uns zu
kontaktieren.
Do you know the effect that you prefer to try out their favorite data pretreatments in combination and often try the same wavelength selections based spectra of the visualized?
You try as six to ten combinations until one of them selects his favorite calibration model, to then continue to optimize. Since then suddenly fall to
outliers, because it goes in depth, so is familiar with the data, we know now the spectra of numbers of outliers and is familiar with the extreme values.
Now, the focus is on the
major components (principal components, Latent Variables, factors) and makes sure not to over-fit and under-fit not to. The whole takes a few hours and finally one is content with the model found.
So
what would happen if you all in the beginning tried variants found outliers removed and re-evaluated and compared? The results would be better than that of the previous model choice? One does not try out? Because it is cumbersome and takes hours again?
We have developed a
software which simplifies this so that also the number of model variations can be increased as desired. The variants generation is automated with an intelligent control system, as well as the optimization and comparing the models and finally the final selection of the best calibration model.
Our software includes all the usual known
data pretreatment methods (data pre-processing) and can combine them useful. Since many Preteatments are directly dependent on the wavelength selection, such as the normalization the determined within a wavelength range of the scaling factors to normalize the spectra so that
pretreatments with the wavelength ranges may be
combined. So a variety of settings sensible model comes together that are all calculated and optimized.
For the automatic selection of the relevant wavelength ranges, different methods are used, which are based on the spectral intensities. Thus, for example, regions with
total absorption is not used, and often interfering water bands removed or retained.
Over all the calculated model variations as a
summary outlier analysis can be made. Are there any new outliers (hidden outlier) discovered, all previous models can be automatically recalculated, optimized and compared without these outliers.
From this great number of calculated models with the statistical quality reviews (prediction performance) the optimum calibration can now be selected. For this purpose, not simply sorting by the prediction error (prediction error, SEP RMSEP) or the coefficient of determination (coefficient of determination r
2), but by several statistical and test values are used jointly toward the final assessment of optimal calibration.
Thus we have created a platform that allows the
highly automated work what a man can never do with a commercial software.
We therefore offer the
largest number of
matched to your application problem modeling calculations and choose the best calibration for you!
This means that our results are faster, more accurate, robust and objective basis (person independent) and quite easy for you to apply.
You have the
full control of the models supplied by us, because we provide a clearly structured and detailed blueprint of the complete calibration, with all settings and parameters, with all necessary statistical characteristics and graphics.
Using this
blueprint, you can adjust the quantitative calibration model itself in the software you use, understand and compare. You have everything under control form model creation, model validation and model refinement.
Your
privacy is very important to us. The NIR data that you briefly provide us for the custom calibration development will remain of course your property. Your NIR data will be deleted after the job with us.
Start Calibrate
Interested, then do not hesitate to
contact us.