Chemometrics
Non-Destructive Sensor-Based Prediction of Maturity and Optimum Harvest Date of Sweet Cherry Fruit | sensors LINK
IDC unveils its Top 10 Predictions for global Robotics Industry Industry40 Robotics LINK
Spectroscopy
Global Molecular Spectroscopy Market is expected to reach USD 6.712 billion till 2024. htt… LINK!
Near Infrared
Assessing pre-harvest sprouting in cereals using near-infrared spectroscopy-based metabolomics LINK
Rapid screening of commercial extra virgin olive oil products for authenticity: Performance of a handheld NIR device LINK
Hyperspectral
Imec () launches TDI, multispectral and hyperspectral sensors | imaging HSI LINK
Near-infrared hyperspectral imaging of lamination and finishing processes in textile technology LINK
Spectral Imaging
Viavi Solutions and ESPROS Photonics Corporation Debut New Miniaturized Spectral Sensor and Multispectral Sensor LINK
Equipment
Meta-lenses bring benchtop performance to small, hand-held spectrometer - Science Daily LINK
Scan anywhere with Neospectra Spectrometer Case powered by XPNDBLS PhotonicsWest … LINK!
Agriculture
World feed production exceeds 1 billion MT LINK
Chemometric soil analysis on the determination of specific bands for the detection of magnesium & potassium by ... LINK
Other
This app uses spectral analysis to analyze objects and their makeup HawkSpex LINK
Research details developments in the multivariate analysis software industry | MVA LINK
"The worlds first ever spectroscopy enabled iPhone!" Check out our video to see it in action: LINK
Investments in AI will triple in 2017. ($47 billion by 2020 per ) CIO CMO | LINK
Some aspects of fetal development have long puzzled scientists, but new molecular technologies are shining a light: https:/… LINK!
CalibrationModel.com
Spectroscopy and Chemometrics News Weekly 3+4, 2017 | Spectroscopy NIRS MVDA… LINK
Spektroskopie und Chemometrie Neuigkeiten Wöchentlich 3+4, 2017 | NIRS Spektroskopie Chemometrie Multivariate LINK
Spettroscopia e Chemiometria Weekly News 3+4, 2017 | NIRS Spettroscopia Chemiometria news LINK
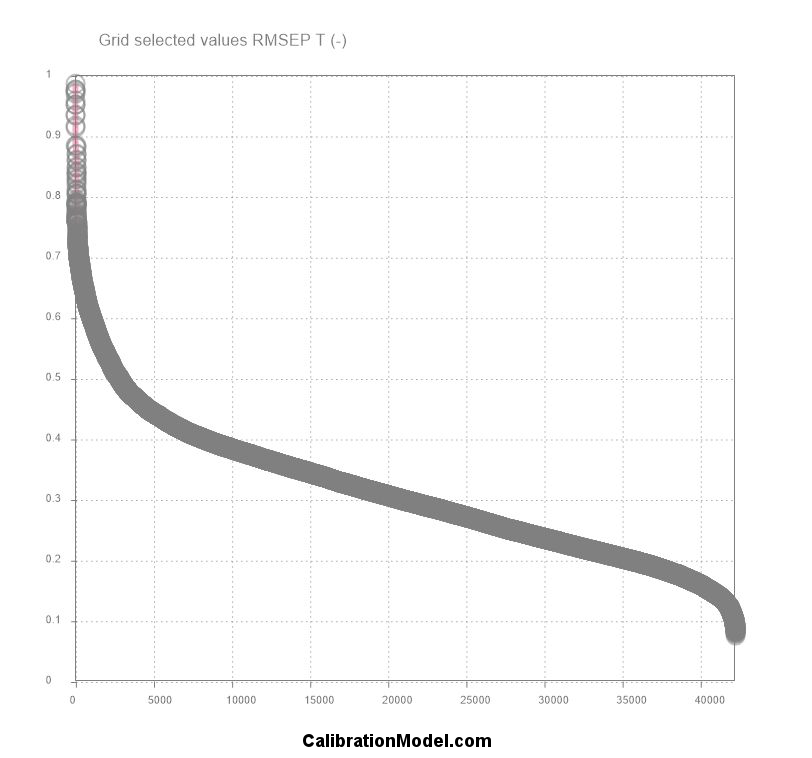
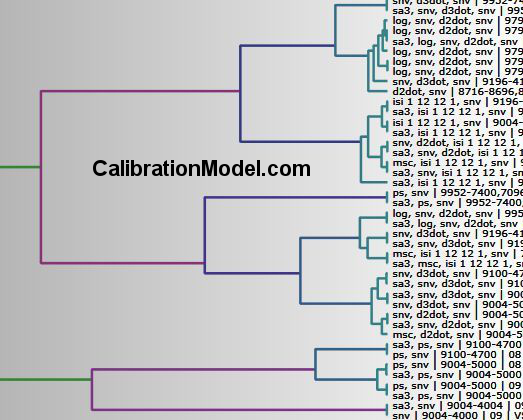
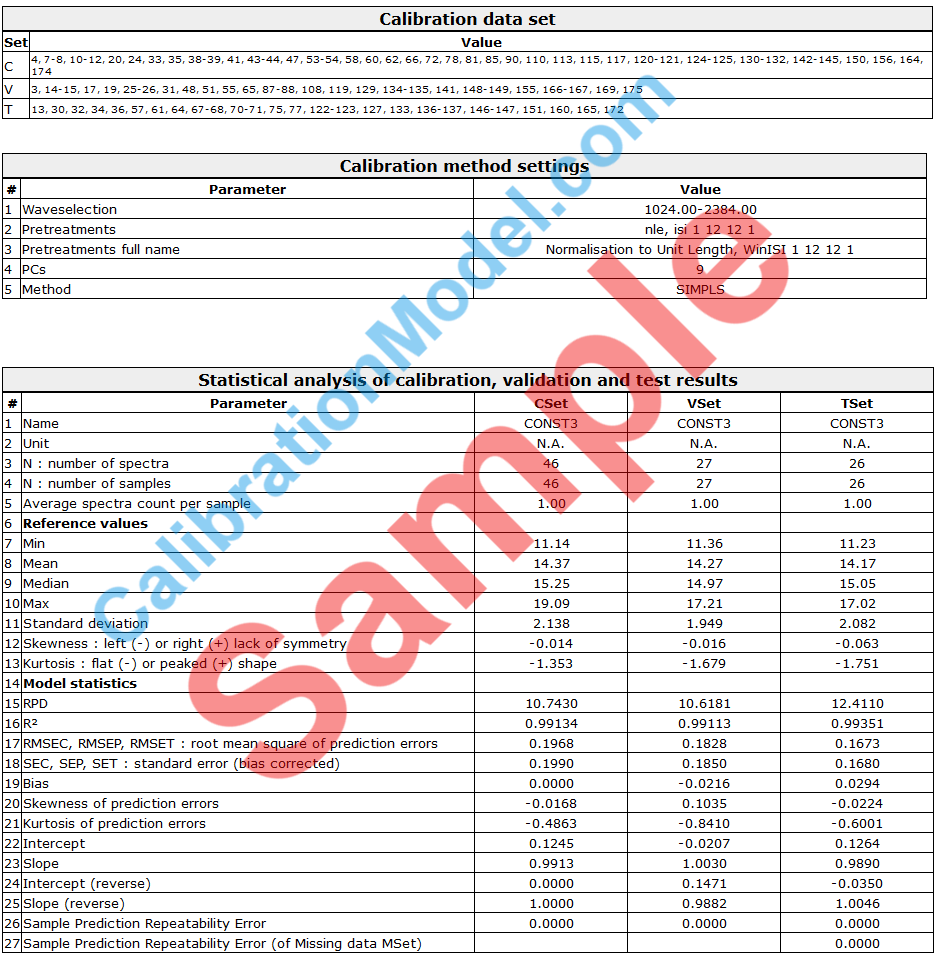
WHITE PAPER: A novel knowledge-based Chemometric Software Framework for quantitative NIRS Calibration Modeling LINK
Improve Accuracy of fast non-destructive NIR Measurements by Optimal Calibration | spectroscopy sensor modeling LINK
NIRS as a secondary method requires extensive calibration on an ongoing basis | foodindustry Digitalization IoT LINK
Services for Optimization of Chemometric Application Methods of Near-Infrared Spectroscopy | Quality Control NIRS LINK
► Timesaving NIRS Calibration ► near-infrared spectroscopy | protein fat moisture sensor measurement scanning LINK
Chemometrics
Non-Destructive Sensor-Based Prediction of Maturity and Optimum Harvest Date of Sweet Cherry Fruit | sensors LINK
IDC unveils its Top 10 Predictions for global Robotics Industry Industry40 Robotics LINK
Spectroscopy
Global Molecular Spectroscopy Market is expected to reach USD 6.712 billion till 2024. htt… LINK!
Near Infrared
Assessing pre-harvest sprouting in cereals using near-infrared spectroscopy-based metabolomics LINK
Rapid screening of commercial extra virgin olive oil products for authenticity: Performance of a handheld NIR device LINK
Hyperspectral
Imec () launches TDI, multispectral and hyperspectral sensors | imaging HSI LINK
Near-infrared hyperspectral imaging of lamination and finishing processes in textile technology LINK
Spectral Imaging
Viavi Solutions and ESPROS Photonics Corporation Debut New Miniaturized Spectral Sensor and Multispectral Sensor LINK
Equipment
Meta-lenses bring benchtop performance to small, hand-held spectrometer - Science Daily LINK
Scan anywhere with Neospectra Spectrometer Case powered by XPNDBLS PhotonicsWest … LINK!
Agriculture
World feed production exceeds 1 billion MT LINK
Chemometric soil analysis on the determination of specific bands for the detection of magnesium & potassium by ... LINK
Other
This app uses spectral analysis to analyze objects and their makeup HawkSpex LINK
Research details developments in the multivariate analysis software industry | MVA LINK
"The worlds first ever spectroscopy enabled iPhone!" Check out our video to see it in action: LINK
Investments in AI will triple in 2017. ($47 billion by 2020 per ) CIO CMO | LINK
Some aspects of fetal development have long puzzled scientists, but new molecular technologies are shining a light: https:/… LINK!
CalibrationModel.com
Spectroscopy and Chemometrics News Weekly 3+4, 2017 | Spectroscopy NIRS MVDA… LINK
Spektroskopie und Chemometrie Neuigkeiten Wöchentlich 3+4, 2017 | NIRS Spektroskopie Chemometrie Multivariate LINK
Spettroscopia e Chemiometria Weekly News 3+4, 2017 | NIRS Spettroscopia Chemiometria news LINK
WHITE PAPER: A novel knowledge-based Chemometric Software Framework for quantitative NIRS Calibration Modeling LINK
Improve Accuracy of fast non-destructive NIR Measurements by Optimal Calibration | spectroscopy sensor modeling LINK
NIRS as a secondary method requires extensive calibration on an ongoing basis | foodindustry Digitalization IoT LINK
Services for Optimization of Chemometric Application Methods of Near-Infrared Spectroscopy | Quality Control NIRS LINK
► Timesaving NIRS Calibration ► near-infrared spectroscopy | protein fat moisture sensor measurement scanning LINK