Spectroscopy and Chemometrics News Weekly #23, 2016Spektroskopie und Chemometrie Neuigkeiten Wöchentlich #23, 2016Spettroscopia e Chemiometria Weekly News #23, 2016

Chemometrics

Comparison of PLS and SVM discriminant analysis for NIR hyperspectral data of wheat roots in soil | NIRS LINK

Determination of reducing sugars in foodstuff applying multivariate second-order calibration LINK

Iterative optimization technology combined with wavelength selection ... for a PAT calibration–minimum approach LINK

Local Strategy Combined with a Wavelength Selection Method for Multivariate Calibration LINK


Near Infrared

Olympus’ new imaging sensor can shoot color and near-infrared simultaneously LINK

fNIRS 2016 Conference Paris, October 13 – 16, 2016. | functional near-infrared spectroscopy (fNIRS) LINK

NIRS for feed and soil analysis in developing countries | NIRS LINK

Acal BFi and inno-spec sign pan-European distribution agreement | VIS NIR NIRS LINK

Evaluating the performance of collimated light for NIR analysis of minced beef samples | NIR spectrophotometer LINK

Optimal partner wavelength combination method with application to near-infrared spectroscopic analysis LINK


Hyperspectral

Chemical Imaging of Heterogeneous Muscle Foods Using Near-Infrared Hyperspectral Imaging in Transmission Mode LINK

Global Hyperspectral Imaging Market Worth USD 152.9 Million by 2020 - Analysis, Technologies & Forecasts Report... LINK


Equipment

"These technologies could be groundbreaking for the development of compact, MEMS-based, mobile mini-spectrometers." LINK


Agriculture

Near infrared spectroscopy in animal nutrition: “are we winning the confidence war? ... LINK


Food & Feed

Bruker : Dairy Foods Webinar-Video on FT-NIR Spectroscopy for the Dairy Industry | Dairy Foods via LINK


Pharma

PAT: “Gateway Drug” to the 21st Century for the Pharma Industry - Pharmaceutical Technology | nearinfrared Raman LINK


Other

Variable selection in multi-block regression LINK


CalibrationModel.com

Develope analytical methods for NIR spectroscopy and optimize for accurate prediction results |20160606_135836 NIRS NIR FTNIR LINK

Entwicklung von Methoden der NIR-Analyse für Lebensmittel- und Milchprodukte | milk milch LINK

How to Develop Near-Infrared Spectroscopy Calibrations in the 21st Century? | Chemometrics Equation Regression PLS LINK

Molecular Spectroscopy use multivariate data analysis modeling calibration validation prediction testing software LINK

NIR User? Get better results faster | Food Science QC Lab Laboratory Manager chemist LabWork Chemie analytik LINK

Optimize NIR Spectroscopy Performance by Recalibrating the Chemometric Models | laboratory measurement equipment LINK

Rapid development of robust quantitative method by near-infrared spectroscopy NIR NIRS LINK

Reduce Workload & Response Time of Near Infrared Reflectance Spectroscopy Analytical Laboratory Method Development LINK

Sie sind NIR Spektroskopie Anwender in QA/QC oder Analytik Labore in Industrie od. Routineanalytik ? Dies spart Zeit LINK

WHITE PAPER: Knowledge-based Chemometrics Software Framework for quantitative NIR Calibration Modeling | PAT LINK


Spectroscopy and Chemometrics News Weekly #21, 2016Spektroskopie und Chemometrie Neuigkeiten Wöchentlich #21, 2016Spettroscopia e Chemiometria Weekly News #21, 2016

Chemometrics

Prediction of water & protein contents& quality classification of Spanish cooked ham using NIR hyperspectral imaging LINK

"Strategy for constructing calibration sets based on a derivative spectra information space consensus" LINK

"Identification and Quantitation of Melamine in Milk by Near-Infrared Spectroscopy and Chemometrics" LINK


Near Infrared

Testing polyethylene using FT-IR, FT-NIR and ICP-MS methods to ensure quality LINK

"Pharmaceutical Raw Material Identification Using Miniature Near-Infrared (MicroNIR) Spectroscopy ..." LINK

Analysis of 22 Performance Properties of Diesel, Gasoline, & Jet Fuels Using a Field-Portable Near-Infrared Analyzer LINK

Jet fuel, crude oil, Diesel blends: Applied NIR-Spectroscopy – quality control of hydrocarbon refining LINK

"Cotton Micronaire Measurements Using Small Portable Near-Infrared (NIR) Analyzers" LINK

"Spectra Transfer Between a FT-NIR Laboratory and a Miniaturized Handheld Near-Infrared Spectrometer" LINK


Equipment

On-Chip Micro–Electro–Mechanical System Fourier Transform Infrared (MEMS FT-IR) Spectrometer-Based Gas Sensing LINK

"Near-Infrared Grating Spectrometer for Mobile Phone Applications" | PDF LINK


Agriculture

Chemist, head of the Canada Wheat Board applies NIR spectroscopy to grade wheat for protein content LINK

Identification of biodiesel feedstock in biodiesel/diesel blends using digital images and chemometric methods LINK


CalibrationModel.com

9 Reasons to Update Your Near-Infrared Spectroscopy Applications LINK

Do you use a near-infrared spectrometer with chemometric Methods? This will save you time |20160526_115026 NIR NIRS SWIR pharma LINK

Erstellung & Optimierung von chemometrischen Auswertemethoden für NIR Spektrometer | nearIR Labor nahinfrarot NIRA LINK

Increase Your Profit with optimized NIR Accuracy Honey Chocolate Bakery LINK

Knowledge-Based Variable Selection and Model Selection for near-infrared spectroscopy NIRS LINK

Quantitative Analytical NIR Method Development for Quality Control Laboratory & Analytical Laboratories | Food QC LINK

Rapid development of robust quantitative methods by near-infrared spectroscopy NIR NIRS LINK

Spectroscopy and Chemometrics News Weekly 20, 2016 | Molecular Spectroscopy NIRS Chemometrics Software Raman LINK

Spektroskopie und Chemometrie Neuigkeiten Wöchentlich 20, 2016 | NIRS Spektroskopie Chemometrie news LINK

Spettroscopia e Chemiometria Weekly News 20, 2016 | NIRS Spettroscopia Chemiometria news LINK


Spectroscopy and Chemometrics News Weekly #1, 2016Spektroskopie und Chemometrie Neuigkeiten Wöchentlich #1, 2016Spettroscopia e Chemiometria Weekly News #1, 2016


Chemometrics

Using NIR Spectroscopy for Real –Time Inline Predictions of Jet Fuel Properties - AZoM LINK


Determination of Omega-3 Fatty Acids in Fish Oil Supplements Using Vibrational Spectroscopy and Chemometric Methods LINK


Abstract: Near infrared multivariate model maintenance: the cornerstone of success LINK


Near Infrared

The Effect of Multiplicative Scatter Correction (MSC) and Linearity Improvement in NIR Spectroscopy | NIRS LINK


Standard Normal Variate Transformation and De-Trending of Near-Infrared Diffuse Reflectance Spectra | NIR NIRS SNV LINK


Magical SCiO gadget scans your food to reveal its nutritional value NIRS LINK


Comparison and data fusion of electronic nose and NIR reflectance spectroscopy for the discrimination of ginsengs LINK


Determination of Total Organic Carbon and Soluble Solids Contents in Tanreqing Injection Intermediates with NIR .. LINK


Infrared

Improved Sensitivity of Infrared Spectroscopy by the Application of Least Squares Methods LINK


Facts

Largest Crude Oil Declines in History '14-16: -68.5% '08-09: -68.2% '90-93: -64.7% '85-86: -63.4% '96-98: -53.5%LINK!


Equipment

The worlds smallest molecular sensor (spectrometer)! Will we see this in a smart phone? LINK!


Assessing potato chip oil quality using a portable IR spectrometer combined with pattern recognition analysis LINK


Future

Top 10 BigData Trends in 2016 for Financial Services | fraud MachineLearning LINK


Agriculture

Applied Spectroscopy's new home with Sage Publishing. Free Access to All Online Issues 1946-2015 LINK


10x Not 10% - Product Management by Orders of Magnitude - by Ken Norton LINK


Food & Feed

Characterization and Detection of Olive Oil Adulterations Using Chemometrics foodfraud LINK


Other

Quanergy Announces $250 Solid-State LIDAR for Cars, Robots, and More | LIDAR LINK


Check for counterfeit medications using mobile spectroscopy pharama CES2016 LINK


Best tech of CES 2016 LINK


SCiO molecular sensor on meet us at CES2016 LINK


Spectroscopy and Chemometrics News Weekly #30, 2015Spektroskopie und Chemometrie Neuigkeiten Wöchentlich #30, 2015Spektroskopie und Chemometrie Neuigkeiten Wöchentlich #30, 2015

Chemometrics

Hyperspectral Analysis of Soil Total Nitrogen in Subsided Land Using the Local Correlation Maximization-Complementary LINK

Distributed Kernel Principal Component Analysis LINK


Near Infrared

Get Ready for the Fully Scannable World | GOOD Magazine | NIRS LINK


Raman

Milliarden von Bildpunkten pro Sekunde in mikroskopischer Auflösung - molekulare Analyse durch Raman-Streuung LINK


Spectral Imaging

Microlens Array Spawns Massive Microscope Image | multispectral LINK


Equipment

The world's first pocket spectrometer measures the molecular makeup of everything LINK

Diamond Services to Release Mini Raman Spectrometer - IDEX Online LINK


Pharma

Researchers demonstrate new multispectral microscope to speed up drug discovery | onmedic ehealth pharma LINK


CalibrationModel.com

News Summary: Spectroscopy and Chemometrics News Weekly 29, 2015 | Molecular Spectroscopy NIRS Chemometrics Raman LINK

Save time & money by replacing labor intensive manual & adhoc NIR data analysis processes | analysis measurement lab LINK

Service für Professionelle Entwicklung von NIR-Kalibrierungen | NIRS Near-Infrared-Spectroscopy LINK

Services for Professional development of NIR calibrations | NIRS Near-Infrared-Spectroscopy QA QC Lab LINK

Use Calibration Model for your customized NIR Applications. Start Optimizing. | NIRS Spectroscopy QAQC pauto LINK


Spectroscopy and Chemometrics News Weekly #27, 2015 Spektroskopie und Chemometrie Neuigkeiten Wöchentlich #27, 2015Spettroscopia e Chemiometria Weekly News #27, 2015

Chemometrics

Chemometric optimization of the robustness of the near infrared spectroscopic method in wheat quality control-PubMed LINK

Algorithms and Technologies for Multispectral, Hyperspectral, and Ultraspectral Imagery LINK

Spectral and Image Integrated Analysis of Hyperspectral Data for Waxy Corn Seed Variety Classification LINK

Spectrophotometer Calibration Standards for NIR Wavelength Accuracy Verification LINK

Big Data Dilemma - Finding the Hidden Value - Automation World | chemometrician LINK


Near Infrared

Novel NIR spectroscopic imaging improves detection of poor circulation LINK

FT-NIR spectroscopy : the estimation of parameters in pretreated lignocellulosic materials for bioethanol production LINK


Infrared

SCIRP Analysis of Human Sperm Characteristics Using Fourier Transform Infrared Spectroscopy LINK

Vibrational Spectroscopy: IR vs. Raman | video LINK


Facts

Why SWIR Band in Remote Sensing? LINK


Equipment

With Tiny Smartphone Spectrometers, Everybody Can Be A Chemist - Popular Science LINK

Quantum-dot spectrometer is small enough to function within a smartphone LINK

A colloidal quantum dot spectrometer - Nature | Spectroscopy LINK


Future

"Surface Analysis Market by Instrumentation Technology, Industry & End User - Global Forecast to 2020" LINK


Agriculture

Feed mill process control with FT-NIR spectroscopy | ag LINK


Food & Feed

Food safety testing market worth $15 billion by 2019 LINK


Other

Quantenpunkt-Spektrometer passt jetzt ins Handy | Spektrometer LINK

Star Trek-style 'tricorders' on their way to customers - The Times of Israel | spectroscopy LINK

Chemometrics and Spectroscopy News Weekly #9, 2015Chemometrie und Spektroskopie Neuigkeiten Wöchentlich #9, 2015Chemiometria e Spettroscopia Weekly News #9, 2015

Get the Chemometrics and Spectroscopy News in real time on Twitter @ CalibModel and follow us.

Chemometrics

Improvement of NIR model by Fractional order Savitzky-Golay derivation (FOSGD) coupled with wavelength selection LINK

Near Infrared

Near-infrared nanolaser : GaAs–AlGaAs nano laser featured in LINK
Near‐Infrared (NIR) Analysis Provides Efficient Evaluation of Biomass Samples | bioenergy LINK
A new alcohol and extract meter for beer : Anton Paar Alex 500 | NIR spectroscopy LINK
Combining NIR Spectroscopy & Machine Vision for Rapid Grain Inspection | NIRS LINK
Near-Infrared Spectroscopy (NIR): In-depth focus 2015 - European Pharmaceutical Review LINK
NIR measuring Asphaltenes in in crude oil. | NIRS LINK
CytoViva Enhanced Darkfield Hyperspectral Microscope Webinar | Nanoparticles VNIR LINK
Tellspec Food Scanner | Handheld Spectrometer TedxZowlle | NIRS LINK
Rapid phosphorous test with NIR helps to hit a moving target in feed formulation: LINK
The future of waste: five things to look for by 2025 | NIRS near-infrared spectroscopy LINK

Raman

Using Raman Spectroscopy in Forensic Science LINK
Raman Spectroscopy in-depth focus 2014 LINK
Surprising behavior benzoic acid raman LINK

Equipment

New compact NIR spectrometer - Avaspec-NIR 256-HSC - Avantes LINK
Bottle Analyzer Performs Within Seconds - industrial FT/NIR spectrometer - LINK
A simple way of making optical spectrometers - TI DLP® technology for spectroscopy - CES2015 LINK

Laboratory

Multivariate Exploratory Data Analysis (MEDA) Toolbox for Matlab LINK
TacticID handheld spectral analysis instrument for non-contact forensic analysis LINK

Other

Explore the spectrometry market that is set to surpass USD 19.6 billion LINK

CalibrationModel.com

Develop & Optimize NIR chemometric methods for Chemical Analysis with ease LINK
Develope analytical methods for FT-NIR spectroscopy and optimize for accurate prediction model | NIRS NIR FTNIR LINK
Development of quantitative Multivariate Prediction Models for Near Infrared Analyzers | NIRS NIR NIT SWIR LINK
Efficient development of new quantitative prediction equations for multivariate NIR spectra data NIRS NIR NIT LINK
Improve your NIR Analysis Results for ProcessControl with optimized Models | PAT Pharma pauto LINK
Increase Your Profit with optimized NIRS Accuracy QA QC Food Feed Lab PetCare vitamins LINK
News: Chemiometria e Spettroscopia Weekly News 8, 2015 | NIRS Spettroscopia Chemiometria news LINK
News: Chemometrics and Spectroscopy News Weekly 8, 2015 | NIRS Spectroscopy Chemometrics news LINK
News: Chemometrie und Spektroskopie Neuigkeiten Wöchentlich 8, 2015 | NIRS Spektroskopie Chemometrie news LINK
Nine Reasons why near-Infrared Spectroscopy Applications need periodic Calibration Maintenance | NIR NIRS Infrared LINK
Quantitative Analytical NIR Method Development for Quality Control Laboratory & Analytical Laboratories | pauto QAQC LINK
Reduce Workload and Response Time of NIRS Analytical Laboratory Method Development | NIRS NIR NIT LINK
Sie verwenden Nah-Infrarot Spektrometer mit Chemometrischen Methoden? Sparen Sie Zeit | pharma food feed NIR LINK
Stop Paying Too Much Time for NIRS Chemometrics Calibration Method development | accuracy measure NIR LINKHolen Sie sich die Chemometrie und Spektroskopie Nachrichten in Echtzeit auf Twitter @ CalibModel


Chemometrics

Improvement of NIR model by Fractional order Savitzky-Golay derivation (FOSGD) coupled with wavelength selection LINK

Near Infrared

Near-infrared nanolaser : GaAs–AlGaAs nano laser featured in LINK
Near‐Infrared (NIR) Analysis Provides Efficient Evaluation of Biomass Samples | bioenergy LINK
A new alcohol and extract meter for beer : Anton Paar Alex 500 | NIR spectroscopy LINK
Combining NIR Spectroscopy & Machine Vision for Rapid Grain Inspection | NIRS LINK
Near-Infrared Spectroscopy (NIR): In-depth focus 2015 - European Pharmaceutical Review LINK
NIR measuring Asphaltenes in in crude oil. | NIRS LINK
CytoViva Enhanced Darkfield Hyperspectral Microscope Webinar | Nanoparticles VNIR LINK
Tellspec Food Scanner | Handheld Spectrometer TedxZowlle | NIRS LINK
Rapid phosphorous test with NIR helps to hit a moving target in feed formulation: LINK
The future of waste: five things to look for by 2025 | NIRS near-infrared spectroscopy LINK

Raman

Using Raman Spectroscopy in Forensic Science LINK
Raman Spectroscopy in-depth focus 2014 LINK
Surprising behavior benzoic acid raman LINK

Equipment

New compact NIR spectrometer - Avaspec-NIR 256-HSC - Avantes LINK
Bottle Analyzer Performs Within Seconds - industrial FT/NIR spectrometer - LINK
A simple way of making optical spectrometers - TI DLP® technology for spectroscopy - CES2015 LINK

Laboratory

Multivariate Exploratory Data Analysis (MEDA) Toolbox for Matlab LINK
TacticID handheld spectral analysis instrument for non-contact forensic analysis LINK

Other

Explore the spectrometry market that is set to surpass USD 19.6 billion LINK

CalibrationModel.com

Develop & Optimize NIR chemometric methods for Chemical Analysis with ease LINK
Develope analytical methods for FT-NIR spectroscopy and optimize for accurate prediction model | NIRS NIR FTNIR LINK
Development of quantitative Multivariate Prediction Models for Near Infrared Analyzers | NIRS NIR NIT SWIR LINK
Efficient development of new quantitative prediction equations for multivariate NIR spectra data NIRS NIR NIT LINK
Improve your NIR Analysis Results for ProcessControl with optimized Models | PAT Pharma pauto LINK
Increase Your Profit with optimized NIRS Accuracy QA QC Food Feed Lab PetCare vitamins LINK
News: Chemiometria e Spettroscopia Weekly News 8, 2015 | NIRS Spettroscopia Chemiometria news LINK
News: Chemometrics and Spectroscopy News Weekly 8, 2015 | NIRS Spectroscopy Chemometrics news LINK
News: Chemometrie und Spektroskopie Neuigkeiten Wöchentlich 8, 2015 | NIRS Spektroskopie Chemometrie news LINK
Nine Reasons why near-Infrared Spectroscopy Applications need periodic Calibration Maintenance | NIR NIRS Infrared LINK
Quantitative Analytical NIR Method Development for Quality Control Laboratory & Analytical Laboratories | pauto QAQC LINK
Reduce Workload and Response Time of NIRS Analytical Laboratory Method Development | NIRS NIR NIT LINK
Sie verwenden Nah-Infrarot Spektrometer mit Chemometrischen Methoden? Sparen Sie Zeit | pharma food feed NIR LINK
Stop Paying Too Much Time for NIRS Chemometrics Calibration Method development | accuracy measure NIR LINKI chemiometria e messaggi di spettroscopia in tempo reale su Twitter @ CalibModel


Chemometrics

Improvement of NIR model by Fractional order Savitzky-Golay derivation (FOSGD) coupled with wavelength selection LINK

Near Infrared

Near-infrared nanolaser : GaAs–AlGaAs nano laser featured in LINK
Near‐Infrared (NIR) Analysis Provides Efficient Evaluation of Biomass Samples | bioenergy LINK
A new alcohol and extract meter for beer : Anton Paar Alex 500 | NIR spectroscopy LINK
Combining NIR Spectroscopy & Machine Vision for Rapid Grain Inspection | NIRS LINK
Near-Infrared Spectroscopy (NIR): In-depth focus 2015 - European Pharmaceutical Review LINK
NIR measuring Asphaltenes in in crude oil. | NIRS LINK
CytoViva Enhanced Darkfield Hyperspectral Microscope Webinar | Nanoparticles VNIR LINK
Tellspec Food Scanner | Handheld Spectrometer TedxZowlle | NIRS LINK
Rapid phosphorous test with NIR helps to hit a moving target in feed formulation: LINK
The future of waste: five things to look for by 2025 | NIRS near-infrared spectroscopy LINK

Raman

Using Raman Spectroscopy in Forensic Science LINK
Raman Spectroscopy in-depth focus 2014 LINK
Surprising behavior benzoic acid raman LINK

Equipment

New compact NIR spectrometer - Avaspec-NIR 256-HSC - Avantes LINK
Bottle Analyzer Performs Within Seconds - industrial FT/NIR spectrometer - LINK
A simple way of making optical spectrometers - TI DLP® technology for spectroscopy - CES2015 LINK

Laboratory

Multivariate Exploratory Data Analysis (MEDA) Toolbox for Matlab LINK
TacticID handheld spectral analysis instrument for non-contact forensic analysis LINK

Other

Explore the spectrometry market that is set to surpass USD 19.6 billion LINK

CalibrationModel.com

Develop & Optimize NIR chemometric methods for Chemical Analysis with ease LINK
Develope analytical methods for FT-NIR spectroscopy and optimize for accurate prediction model | NIRS NIR FTNIR LINK
Development of quantitative Multivariate Prediction Models for Near Infrared Analyzers | NIRS NIR NIT SWIR LINK
Efficient development of new quantitative prediction equations for multivariate NIR spectra data NIRS NIR NIT LINK
Improve your NIR Analysis Results for ProcessControl with optimized Models | PAT Pharma pauto LINK
Increase Your Profit with optimized NIRS Accuracy QA QC Food Feed Lab PetCare vitamins LINK
News: Chemiometria e Spettroscopia Weekly News 8, 2015 | NIRS Spettroscopia Chemiometria news LINK
News: Chemometrics and Spectroscopy News Weekly 8, 2015 | NIRS Spectroscopy Chemometrics news LINK
News: Chemometrie und Spektroskopie Neuigkeiten Wöchentlich 8, 2015 | NIRS Spektroskopie Chemometrie news LINK
Nine Reasons why near-Infrared Spectroscopy Applications need periodic Calibration Maintenance | NIR NIRS Infrared LINK
Quantitative Analytical NIR Method Development for Quality Control Laboratory & Analytical Laboratories | pauto QAQC LINK
Reduce Workload and Response Time of NIRS Analytical Laboratory Method Development | NIRS NIR NIT LINK
Sie verwenden Nah-Infrarot Spektrometer mit Chemometrischen Methoden? Sparen Sie Zeit | pharma food feed NIR LINK
Stop Paying Too Much Time for NIRS Chemometrics Calibration Method development | accuracy measure NIR LINK

We make NIR Chemometrics easyWir machen NIR Chemometrie einfach

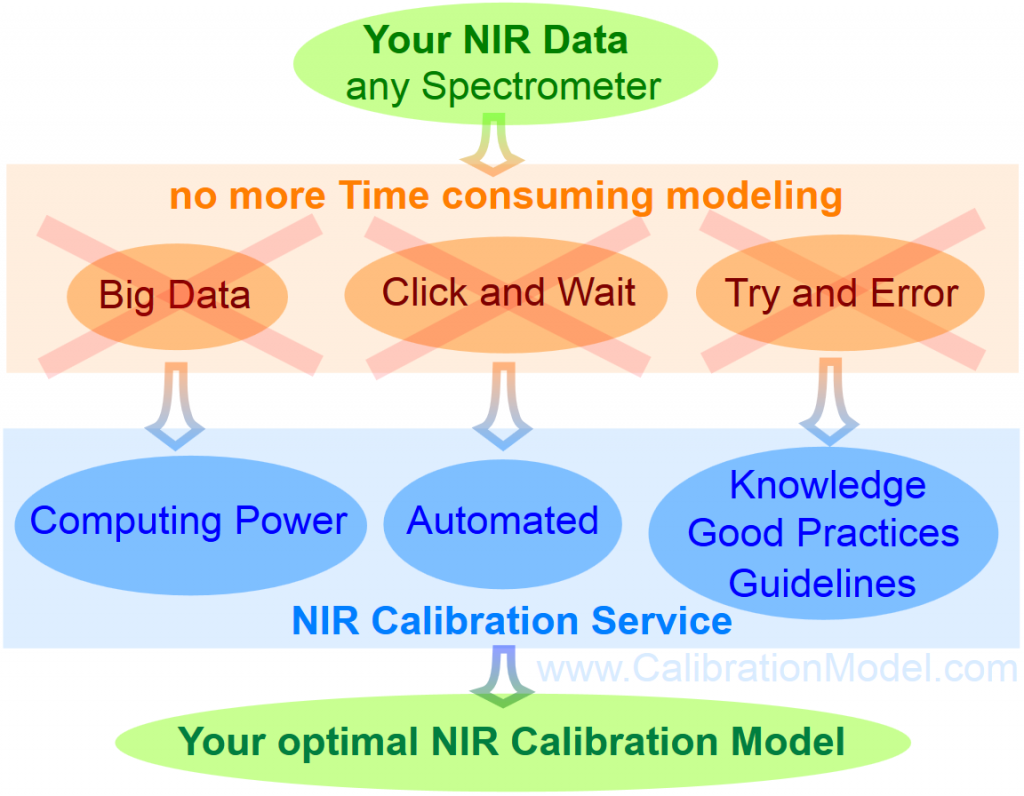
Hi, we're CalibrationModel. Our aim is to transform your NIR data to superior calibration models. We do this by using knowledge driven software applying good practices and rules from literature, publications, regulatory guidelines and more. Our service is used by NIR specialists to deliver a valuable model for their NIR analysis measurements. With CalibrationModel services, NIR specialists can find out how their NIR Data can be robust and optimally modeled by which data preprocessing and wavelength selection, etc. You can implement CalibrationModel in a matter of minutes using our contact form and send your NIR data to receive optimized model settings as a blueprint.

NIR specialists (Spectroscopist, Chemometricians) love perfect models. They're curious about how to improve their models even further, because all NIR models need continuous maintenance and updates.


Using CalibrationModel services, NIR Specialists can deliver real value to their measurement results through powerful model optimization capabilities.


CalibrationModel
We make NIR Chemometrics easy.

Near-Infrared Data Modeling Calibration Service

Procedures for NIR calibration – Creation of NIRS spectroscopy calibration curvesArbeitsweisen zur NIR Kalibrierung – Erstellung von NIRS-Spektroskopie Kalibrierungskurven Le procedure di calibrazione NIR – Realizzazione di curve di calibrazione NIRS spettroscopia

Do you know the effect that you prefer to try out their favorite data pretreatments in combination and often try the same wavelength selections based spectra of the visualized?

You try as six to ten combinations until one of them selects his favorite calibration model, to then continue to optimize. Since then suddenly fall to outliers, because it goes in depth, so is familiar with the data, we know now the spectra of numbers of outliers and is familiar with the extreme values.

Now, the focus is on the major components (principal components, Latent Variables, factors) and makes sure not to over-fit and under-fit not to. The whole takes a few hours and finally one is content with the model found.

So what would happen if you all in the beginning tried variants found outliers removed and re-evaluated and compared? The results would be better than that of the previous model choice? One does not try out? Because it is cumbersome and takes hours again?

We have developed a software which simplifies this so that also the number of model variations can be increased as desired. The variants generation is automated with an intelligent control system, as well as the optimization and comparing the models and finally the final selection of the best calibration model.

Our software includes all the usual known data pretreatment methods (data pre-processing) and can combine them useful. Since many Preteatments are directly dependent on the wavelength selection, such as the normalization the determined within a wavelength range of the scaling factors to normalize the spectra so that pretreatments with the wavelength ranges may be combined. So a variety of settings sensible model comes together that are all calculated and optimized. For the automatic selection of the relevant wavelength ranges, different methods are used, which are based on the spectral intensities. Thus, for example, regions with total absorption is not used, and often interfering water bands removed or retained.

Over all the calculated model variations as a summary outlier analysis can be made. Are there any new outliers (hidden outlier) discovered, all previous models can be automatically recalculated, optimized and compared without these outliers.

From this great number of calculated models with the statistical quality reviews (prediction performance) the optimum calibration can now be selected. For this purpose, not simply sorting by the prediction error (prediction error, SEP RMSEP) or the coefficient of determination (coefficient of determination r2), but by several statistical and test values are used jointly toward the final assessment of optimal calibration.

Thus we have created a platform that allows the highly automated work what a man can never do with a commercial software.

We therefore offer the largest number of matched to your application problem modeling calculations and choose the best calibration for you!

This means that our results are faster, more accurate, robust and objective basis (person independent) and quite easy for you to apply.

You have the full control of the models supplied by us, because we provide a clearly structured and detailed blueprint of the complete calibration, with all settings and parameters, with all necessary statistical characteristics and graphics.

Using this blueprint, you can adjust the quantitative calibration model itself in the software you use, understand and compare. You have everything under control form model creation, model validation and model refinement.

Your privacy is very important to us. The NIR data that you briefly provide us for the custom calibration development will remain of course your property. Your NIR data will be deleted after the job with us.


Start Calibrate


Interested, then do not hesitate to contact us.

Kennen Sie den Effekt, dass Sie bevorzugt ihre Lieblings-Datenvorbehandlungen in Kombination durchprobieren und oft die gleichen Wellenlängen-Selektionen anhand der visualisierten Spektren ausprobieren?

Man probiert z.B. sechs bis zehn Kombinationen aus, bis man davon sein favorisiertes Kalibrationsmodell auswählt, um es dann weiter zu optimieren. Da fallen dann plötzlich Ausreisser (Outlier) auf, weil man in die Tiefe geht, also mit den Daten vertraut ist, man kennt mittlerweile die Spektren-Nummern der Ausreisser und ist mit den Extremwerten vertraut.

Jetzt fokussiert man sich auf die Hauptkomponenten (Principal Components, Latent Variables, Faktoren) und achtet darauf nicht zu über-fitten und nicht zu unter-fitten. Das ganze dauert ein paar Stunden und schliesslich begnügt man sich mit dem gefundenen Modell.

Was wäre nun, wenn man in all den zu Beginn ausprobierten Varianten, die gefundenen Ausreisser entfernt und nochmals berechnet und vergleicht? Wären die Ergebnisse besser als die von der bisherigen Modell Wahl? Man probiert es nicht aus? Weil es mühsam ist und wieder Stunden dauert?

Wir haben eine Software entwickelt die dies so vereinfacht, dass auch die Anzahl der Modell Variationen beliebig erhöht werden kann. Die Varianten Erzeugung läuft automatisiert mit einem intelligenten Regelsystem, so auch die Optimierung und das Vergleichen der Modelle und schliesslich die finale Auswahl des Besten Kalibrations Modell.

Unsere Software beinhaltet alle üblichen bekannten Datenvorbehandlungs Methoden (Preteatments) und kann diese sinnvoll kombinieren. Da viele Preteatments direkt abhängig sind von der Wellenlängen Selektion, so z.B. die Normalisierungen die innerhalb eines Wellenlängen-Bereiches die Skalierungsfaktoren ermittelt, um die Spektren damit zu normieren, werden die Pretreatments mit dem Wellenlängen-Bereichen kombiniert. So kommt eine Vielzahl von sinnvollen Modell Einstellungen zusammen die alle berechnet und optimiert werden.

Für die automatische Auswahl der relevanten Wellenlängen Bereiche kommen verschiedene Methoden zum Einsatz, die sich an den Spektren Intensitäten orientieren. So werden z.B. Bereiche mit Totalabsorption nicht verwendet, oftmals störende Wasserbanden entfernt oder beibehalten.

Über all die berechneten Modell Variationen können so zusammenfassende Outlier Analysen gemacht werden. Werden durch die gefahrenen Versuche neue Outlier (Hidden Outlier) entdeckt, können alle bisherigen Modelle automatisch ohne diese Ausreisser nachberechnet, optimiert und verglichen werden.

Aus dieser Vielzahl berechneter Modelle mit deren Statistischen Güte Bewertungen (Prediction Performance) kann nun die optimale Kalibration ausgewählt werden. Dazu wird nicht einfach nach dem Vorhersage Fehler (Prediction Error, SEP, RMSEP) oder nach dem Bestimmtheitsmaß (Coefficient of Determination r2) sortiert, sondern mehrere Statistik- und Testwerte gemeinsam zur umfänglichen Beurteilung der optimalen Kalibration herangezogen.

Somit haben wir eine Plattform geschaffen, die es ermöglicht hochgradig automatisiert das zu tun, was ein Mensch niemals mit einer handelsüblichen Software tun kann.

Wir bieten damit die grösste Anzahl auf Ihr Applikations-Problem angepasste Modellierungs-Berechnungen und wählen die beste Kalibration für Sie aus!

Das heisst, unsere Ergebnisse sind schneller, genauer, robuster und objektiv ausgewählt (Personen unabhängig) und für Sie ganz einfach anzuwenden.

Die Kontrolle über die von uns gelieferten Modelle haben Sie vollumfänglich, denn wir liefern einen klar strukturierten und detaillierten Bauplan der  kompletten Kalibration, mit allen Einstellungen und Parametern, mit allen notwendigen Statistischen Kenngrössen und Grafiken.

Anhand dieses Bauplans können Sie das quantitative Kalibrations Modell selbst in der von Ihnen verwendeten Software nachstellen, nachvollziehen und vergleichen. Sie haben so alles im Griff, für die Modell-Validierung und die Modellpflege.

Der Datenschutz ist uns sehr wichtig. Die NIR Daten, die Sie uns für die Kalibrations-Erstellung kurzzeitig zu Verfügung stellen bleiben selbstverständlich Ihr Eigentum. Ihre NIR Daten werden nach Abschluss des Auftrags bei uns gelöscht.


Start Calibrate


Interessiert, dann zögern Sie nicht uns zu kontaktieren.

Do you know the effect that you prefer to try out their favorite data pretreatments in combination and often try the same wavelength selections based spectra of the visualized?

You try as six to ten combinations until one of them selects his favorite calibration model, to then continue to optimize. Since then suddenly fall to outliers, because it goes in depth, so is familiar with the data, we know now the spectra of numbers of outliers and is familiar with the extreme values.

Now, the focus is on the major components (principal components, Latent Variables, factors) and makes sure not to over-fit and under-fit not to. The whole takes a few hours and finally one is content with the model found.

So what would happen if you all in the beginning tried variants found outliers removed and re-evaluated and compared? The results would be better than that of the previous model choice? One does not try out? Because it is cumbersome and takes hours again?

We have developed a software which simplifies this so that also the number of model variations can be increased as desired. The variants generation is automated with an intelligent control system, as well as the optimization and comparing the models and finally the final selection of the best calibration model.

Our software includes all the usual known data pretreatment methods (data pre-processing) and can combine them useful. Since many Preteatments are directly dependent on the wavelength selection, such as the normalization the determined within a wavelength range of the scaling factors to normalize the spectra so that pretreatments with the wavelength ranges may be combined. So a variety of settings sensible model comes together that are all calculated and optimized. For the automatic selection of the relevant wavelength ranges, different methods are used, which are based on the spectral intensities. Thus, for example, regions with total absorption is not used, and often interfering water bands removed or retained.

Over all the calculated model variations as a summary outlier analysis can be made. Are there any new outliers (hidden outlier) discovered, all previous models can be automatically recalculated, optimized and compared without these outliers.

From this great number of calculated models with the statistical quality reviews (prediction performance) the optimum calibration can now be selected. For this purpose, not simply sorting by the prediction error (prediction error, SEP RMSEP) or the coefficient of determination (coefficient of determination r2), but by several statistical and test values are used jointly toward the final assessment of optimal calibration.

Thus we have created a platform that allows the highly automated work what a man can never do with a commercial software.

We therefore offer the largest number of matched to your application problem modeling calculations and choose the best calibration for you!

This means that our results are faster, more accurate, robust and objective basis (person independent) and quite easy for you to apply.

You have the full control of the models supplied by us, because we provide a clearly structured and detailed blueprint of the complete calibration, with all settings and parameters, with all necessary statistical characteristics and graphics.

Using this blueprint, you can adjust the quantitative calibration model itself in the software you use, understand and compare. You have everything under control form model creation, model validation and model refinement.

Your privacy is very important to us. The NIR data that you briefly provide us for the custom calibration development will remain of course your property. Your NIR data will be deleted after the job with us.


Start Calibrate


Interested, then do not hesitate to contact us.

NIRS Calibration Model Equation – Optimal Predictive Model SelectionNIRS Calibration Model Equation – Optimal Predictive Model SelectionNIRS Calibration Model Equation – Optimal Predictive Model Selection

To give you an insight what we do to find the optimal model, imagine a NIR data set, where a NIR specialist works hard for 4 hours in his chemometric software to try what he can with his chemometric-, NIR spectroscopic- and his product-knowledge to get a good model. During the 4 hours he finds 3 final candidate models for his application. With the RMSEP of 0.49 , 0.51 and 0.6. Now he has to choose one or to test all his three models on new measured NIR spectra.

That is common practice. But is this good practice?

And nobody asks, how long, how hard have you tried, how many trial have you done, if this really the best model that is possible from the data?
And imagine the cost of the data collection including the lab analytics!
And behind this costs, have you really tried hard enough to get the best out of your data? Was the calibration done quick and dirty on a Friday afternoon? Yes, time is limited and manually clicking around and wait in such kind of software is not really fun, so what are the consequences?

Now I come to the most important core point ever, if you own expensive NIR spectrometer system, or even many of them, and your company has collected a lot of NIR spectra and expensive Lab-reference data over years, do you spend just a few hours to develop and build that model, that will define the whole system's measurement performance for the future? And ask yourself again (and your boss will ask you later), have you really tried hard enough, to get the best out of your data? really?

What else is possible? What does your competition do?

There is no measure (yet) what can be reached with a specific NIR data set.
And this is very interesting, because there are different beliefs if a secondary method like NIR or Raman can be more precise and accurate, as the primary method.

What we do different is, that our highly specialized software is capable of creating large amounts of useful calibrations to investigate this limits – what is possible. It's done by permutation and combination of spectra-selection, wave-selection, pre-processing sequences and PC selections. If you are common with this, then you know that the possibilities are huge.

For a pre-screening, we create e.g. 42'000 useful calibrations for the mentioned data set. With useful we mean that the model is usable, e.g. R² is higher than 0.8, which shows a good correlation between the spectra and the constituent and it is well fitted (neither over-fitted nor under-fitted) because the PC selection for the calibration-set is estimated by the validation-set and the predictive performance of the test-set is used for model comparisons.

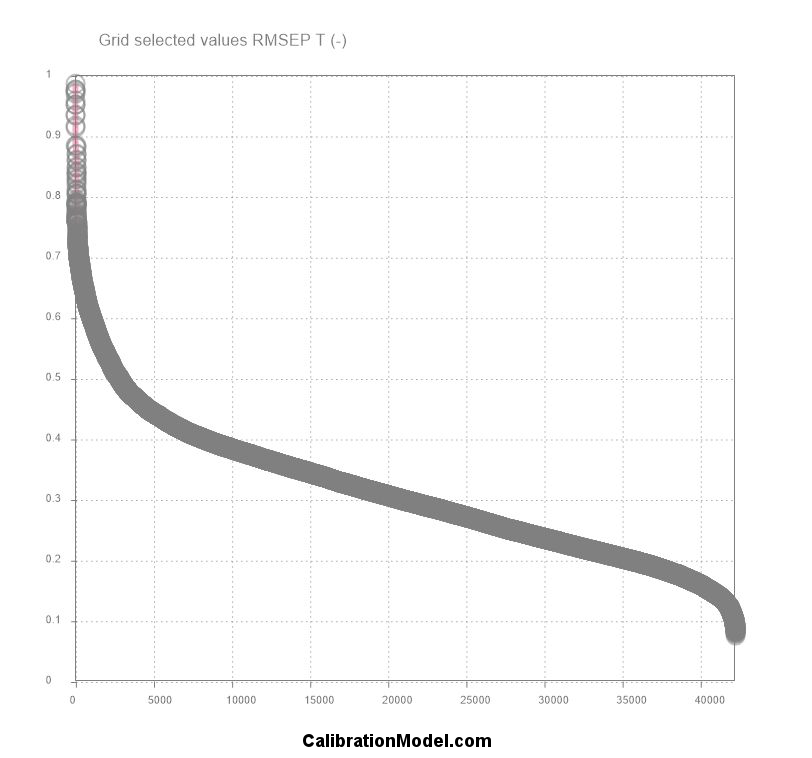
Here the sorted RMSEP values of the Test Set is shown for 42'000 calibrations.
You can immediately see that the manually found performance of 0.49 is just in the starting phase of our optimization. Interesting is the steep fall from 1.0 to 0.5 where manually optimization found it's solutions. A range where ca. 2500 different useful calibrations exist. The following less steep fall from 0.5 to 0.2 contains a lot more useful models and between 0.2 to 0.08 the obvious high accurate models are around 2500 different ones. So the golden needle is not in the first 2500 models, it must be somewhere in the last 2500 models in the haystack.

Sorted RMSEP plot of 42'000 NIR Calibration Model Candidates

That allows us to pick the best calibration out of 42'000 models, depending on multiple statistical evaluation criteria, that is not just the R² or RPD, SEC, SEP or RMSEP, (or Akaike Information Criterion (AIC), Bayesian Information Criterion (BIC), Multivariate AIC  (MAIC) etc.) we do the model selection based on multiple statistical parameters.

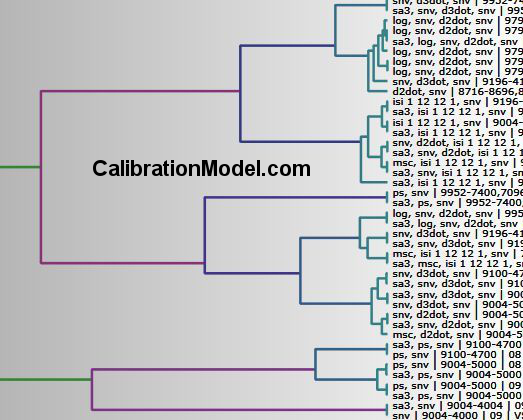
Dengrogram plot of similar  NIR Calibration Models

To compare the calibration models by similarity it is best viewed with dendrogram plots like this (zoomed in), where the settings are shown versus the models overall performance similarity. In the settings you can see a lot of different permutations of pre-processings combined with different wave-selections.

To give you an insight what we do to find the optimal model, imagine a NIR data set, where a NIR specialist works hard for 4 hours in his chemometric software to try what he can with his chemometric-, NIR spectroscopic- and his product-knowledge to get a good model. During the 4 hours he finds 3 final candidate models for his application. With the RMSEP of 0.49 , 0.51 and 0.6. Now he has to choose one or to test all his three models on new measured NIR spectra.

That is common practice. But is this good practice?

And nobody asks, how long, how hard have you tried, how many trial have you done, if this really the best model that is possible from the data?
And imagine the cost of the data collection including the lab analytics!
And behind this costs, have you really tried hard enough to get the best out of your data? Was the calibration done quick and dirty on a Friday afternoon? Yes, time is limited and manually clicking around and wait in such kind of software is not really fun, so what are the consequences?

Now I come to the most important core point ever, if you own expensive NIR spectrometer system, or even many of them, and your company has collected a lot of NIR spectra and expensive Lab-reference data over years, do you spend just a few hours to develop and build that model, that will define the whole system's measurement performance for the future? And ask yourself again (and your boss will ask you later), have you really tried hard enough, to get the best out of your data? really?

What else is possible? What does your competition do?

There is no measure (yet) what can be reached with a specific NIR data set.
And this is very interesting, because there are different beliefs if a secondary method like NIR or Raman can be more precise and accurate, as the primary method.

What we do different is, that our highly specialized software is capable of creating large amounts of useful calibrations to investigate this limits – what is possible. It's done by permutation and combination of spectra-selection, wave-selection, pre-processing sequences and PC selections. If you are common with this, then you know that the possibilities are huge.

For a pre-screening, we create e.g. 42'000 useful calibrations for the mentioned data set. With useful we mean that the model is usable, e.g. R² is higher than 0.8, which shows a good correlation between the spectra and the constituent and it is well fitted (neither over-fitted nor under-fitted) because the PC selection for the calibration-set is estimated by the validation-set and the predictive performance of the test-set is used for model comparisons.

Here the sorted RMSEP values of the Test Set is shown for 42'000 calibrations.
You can immediately see that the manually found performance of 0.49 is just in the starting phase of our optimization. Interesting is the steep fall from 1.0 to 0.5 where manually optimization found it's solutions. A range where ca. 2500 different useful calibrations exist. The following less steep fall from 0.5 to 0.2 contains a lot more useful models and between 0.2 to 0.08 the obvious high accurate models are around 2500 different ones. So the golden needle is not in the first 2500 models, it must be somewhere in the last 2500 models in the haystack.

Sorted RMSEP plot of 42'000 NIR Calibration Model Candidates

That allows us to pick the best calibration out of 42'000 models, depending on multiple statistical evaluation criteria, that is not just the R² or RPD, SEC, SEP or RMSEP, (or Akaike Information Criterion (AIC), Bayesian Information Criterion (BIC), Multivariate AIC (MAIC) etc.) we do the model selection based on multiple statistical parameters.

Dengrogram plot of similar  NIR Calibration Models

To compare the calibration models by similarity it is best viewed with dendrogram plots like this (zoomed in), where the settings are shown versus the models overall performance similarity. In the settings you can see a lot of different permutations of pre-processings combined with different wave-selections.