Do you know the effect that you prefer to try out their favorite data pretreatments in combination and often try the same wavelength selections based spectra of the visualized?
You try as six to ten combinations until one of them selects his favorite calibration model, to then continue to optimize. Since then suddenly fall to outliers, because it goes in depth, so is familiar with the data, we know now the spectra of numbers of outliers and is familiar with the extreme values.
Now, the focus is on the major components (principal components, Latent Variables, factors) and makes sure not to over-fit and under-fit not to. The whole takes a few hours and finally one is content with the model found.
So what would happen if you all in the beginning tried variants found outliers removed and re-evaluated and compared? The results would be better than that of the previous model choice? One does not try out? Because it is cumbersome and takes hours again?
We have developed a software which simplifies this so that also the number of model variations can be increased as desired. The variants generation is automated with an intelligent control system, as well as the optimization and comparing the models and finally the final selection of the best calibration model.
Our software includes all the usual known data pretreatment methods (data pre-processing) and can combine them useful. Since many Preteatments are directly dependent on the wavelength selection, such as the normalization the determined within a wavelength range of the scaling factors to normalize the spectra so that pretreatments with the wavelength ranges may be combined. So a variety of settings sensible model comes together that are all calculated and optimized.
For the automatic selection of the relevant wavelength ranges, different methods are used, which are based on the spectral intensities. Thus, for example, regions with total absorption is not used, and often interfering water bands removed or retained.
Over all the calculated model variations as a summary outlier analysis can be made. Are there any new outliers (hidden outlier) discovered, all previous models can be automatically recalculated, optimized and compared without these outliers.
From this great number of calculated models with the statistical quality reviews (prediction performance) the optimum calibration can now be selected. For this purpose, not simply sorting by the prediction error (prediction error, SEP RMSEP) or the coefficient of determination (coefficient of determination r2), but by several statistical and test values are used jointly toward the final assessment of optimal calibration.
Thus we have created a platform that allows the highly automated work what a man can never do with a commercial software.
We therefore offer the largest number of matched to your application problem modeling calculations and choose the best calibration for you!
This means that our results are faster, more accurate, robust and objective basis (person independent) and quite easy for you to apply.
You have the full control of the models supplied by us, because we provide a clearly structured and detailed blueprint of the complete calibration, with all settings and parameters, with all necessary statistical characteristics and graphics.
Using this blueprint, you can adjust the quantitative calibration model itself in the software you use, understand and compare. You have everything under control form model creation, model validation and model refinement.
Your privacy is very important to us. The NIR data that you briefly provide us for the custom calibration development will remain of course your property. Your NIR data will be deleted after the job with us.
Start Calibrate
Interested, then do not hesitate to contact us.
Kennen Sie den Effekt, dass Sie bevorzugt ihre Lieblings-Datenvorbehandlungen in Kombination durchprobieren und oft die gleichen Wellenlängen-Selektionen anhand der visualisierten Spektren ausprobieren?
Man probiert z.B. sechs bis zehn Kombinationen aus, bis man davon sein favorisiertes Kalibrationsmodell auswählt, um es dann weiter zu optimieren. Da fallen dann plötzlich Ausreisser (Outlier) auf, weil man in die Tiefe geht, also mit den Daten vertraut ist, man kennt mittlerweile die Spektren-Nummern der Ausreisser und ist mit den Extremwerten vertraut.
Jetzt fokussiert man sich auf die Hauptkomponenten (Principal Components, Latent Variables, Faktoren) und achtet darauf nicht zu über-fitten und nicht zu unter-fitten. Das ganze dauert ein paar Stunden und schliesslich begnügt man sich mit dem gefundenen Modell.
Was wäre nun, wenn man in all den zu Beginn ausprobierten Varianten, die gefundenen Ausreisser entfernt und nochmals berechnet und vergleicht? Wären die Ergebnisse besser als die von der bisherigen Modell Wahl? Man probiert es nicht aus? Weil es mühsam ist und wieder Stunden dauert?
Wir haben eine Software entwickelt die dies so vereinfacht, dass auch die Anzahl der Modell Variationen beliebig erhöht werden kann. Die Varianten Erzeugung läuft automatisiert mit einem intelligenten Regelsystem, so auch die Optimierung und das Vergleichen der Modelle und schliesslich die finale Auswahl des Besten Kalibrations Modell.
Unsere Software beinhaltet alle üblichen bekannten Datenvorbehandlungs Methoden (Preteatments) und kann diese sinnvoll kombinieren. Da viele Preteatments direkt abhängig sind von der Wellenlängen Selektion, so z.B. die Normalisierungen die innerhalb eines Wellenlängen-Bereiches die Skalierungsfaktoren ermittelt, um die Spektren damit zu normieren, werden die Pretreatments mit dem Wellenlängen-Bereichen kombiniert. So kommt eine Vielzahl von sinnvollen Modell Einstellungen zusammen die alle berechnet und optimiert werden.
Für die automatische Auswahl der relevanten Wellenlängen Bereiche kommen verschiedene Methoden zum Einsatz, die sich an den Spektren Intensitäten orientieren. So werden z.B. Bereiche mit Totalabsorption nicht verwendet, oftmals störende Wasserbanden entfernt oder beibehalten.
Über all die berechneten Modell Variationen können so zusammenfassende Outlier Analysen gemacht werden. Werden durch die gefahrenen Versuche neue Outlier (Hidden Outlier) entdeckt, können alle bisherigen Modelle automatisch ohne diese Ausreisser nachberechnet, optimiert und verglichen werden.
Aus dieser Vielzahl berechneter Modelle mit deren Statistischen Güte Bewertungen (Prediction Performance) kann nun die optimale Kalibration ausgewählt werden. Dazu wird nicht einfach nach dem Vorhersage Fehler (Prediction Error, SEP, RMSEP) oder nach dem Bestimmtheitsmaß (Coefficient of Determination r2) sortiert, sondern mehrere Statistik- und Testwerte gemeinsam zur umfänglichen Beurteilung der optimalen Kalibration herangezogen.
Somit haben wir eine Plattform geschaffen, die es ermöglicht hochgradig automatisiert das zu tun, was ein Mensch niemals mit einer handelsüblichen Software tun kann.
Wir bieten damit die grösste Anzahl auf Ihr Applikations-Problem angepasste Modellierungs-Berechnungen und wählen die beste Kalibration für Sie aus!
Das heisst, unsere Ergebnisse sind schneller, genauer, robuster und objektiv ausgewählt (Personen unabhängig) und für Sie ganz einfach anzuwenden.
Die Kontrolle über die von uns gelieferten Modelle haben Sie vollumfänglich, denn wir liefern einen klar strukturierten und detaillierten Bauplan der kompletten Kalibration, mit allen Einstellungen und Parametern, mit allen notwendigen Statistischen Kenngrössen und Grafiken.
Anhand dieses Bauplans können Sie das quantitative Kalibrations Modell selbst in der von Ihnen verwendeten Software nachstellen, nachvollziehen und vergleichen. Sie haben so alles im Griff, für die Modell-Validierung und die Modellpflege.
Der Datenschutz ist uns sehr wichtig. Die NIR Daten, die Sie uns für die Kalibrations-Erstellung kurzzeitig zu Verfügung stellen bleiben selbstverständlich Ihr Eigentum. Ihre NIR Daten werden nach Abschluss des Auftrags bei uns gelöscht.
Start Calibrate
Interessiert, dann zögern Sie nicht uns zu kontaktieren.
Do you know the effect that you prefer to try out their favorite data pretreatments in combination and often try the same wavelength selections based spectra of the visualized?
You try as six to ten combinations until one of them selects his favorite calibration model, to then continue to optimize. Since then suddenly fall to outliers, because it goes in depth, so is familiar with the data, we know now the spectra of numbers of outliers and is familiar with the extreme values.
Now, the focus is on the major components (principal components, Latent Variables, factors) and makes sure not to over-fit and under-fit not to. The whole takes a few hours and finally one is content with the model found.
So what would happen if you all in the beginning tried variants found outliers removed and re-evaluated and compared? The results would be better than that of the previous model choice? One does not try out? Because it is cumbersome and takes hours again?
We have developed a software which simplifies this so that also the number of model variations can be increased as desired. The variants generation is automated with an intelligent control system, as well as the optimization and comparing the models and finally the final selection of the best calibration model.
Our software includes all the usual known data pretreatment methods (data pre-processing) and can combine them useful. Since many Preteatments are directly dependent on the wavelength selection, such as the normalization the determined within a wavelength range of the scaling factors to normalize the spectra so that pretreatments with the wavelength ranges may be combined. So a variety of settings sensible model comes together that are all calculated and optimized.
For the automatic selection of the relevant wavelength ranges, different methods are used, which are based on the spectral intensities. Thus, for example, regions with total absorption is not used, and often interfering water bands removed or retained.
Over all the calculated model variations as a summary outlier analysis can be made. Are there any new outliers (hidden outlier) discovered, all previous models can be automatically recalculated, optimized and compared without these outliers.
From this great number of calculated models with the statistical quality reviews (prediction performance) the optimum calibration can now be selected. For this purpose, not simply sorting by the prediction error (prediction error, SEP RMSEP) or the coefficient of determination (coefficient of determination r2), but by several statistical and test values are used jointly toward the final assessment of optimal calibration.
Thus we have created a platform that allows the highly automated work what a man can never do with a commercial software.
We therefore offer the largest number of matched to your application problem modeling calculations and choose the best calibration for you!
This means that our results are faster, more accurate, robust and objective basis (person independent) and quite easy for you to apply.
You have the full control of the models supplied by us, because we provide a clearly structured and detailed blueprint of the complete calibration, with all settings and parameters, with all necessary statistical characteristics and graphics.
Using this blueprint, you can adjust the quantitative calibration model itself in the software you use, understand and compare. You have everything under control form model creation, model validation and model refinement.
Your privacy is very important to us. The NIR data that you briefly provide us for the custom calibration development will remain of course your property. Your NIR data will be deleted after the job with us.
Start Calibrate
Interested, then do not hesitate to contact us.
NIRS Calibration Model Equation – Optimal Predictive Model SelectionNIRS Calibration Model Equation – Optimal Predictive Model SelectionNIRS Calibration Model Equation – Optimal Predictive Model Selection
To give you an insight what we do to find the optimal model, imagine a NIR data set, where a NIR specialist works hard for 4 hours in his chemometric software to try what he can with his chemometric-, NIR spectroscopic- and his product-knowledge to get a good model. During the 4 hours he finds 3 final candidate models for his application. With the RMSEP of 0.49 , 0.51 and 0.6. Now he has to choose one or to test all his three models on new measured NIR spectra.
That is common practice. But is this good practice?
And nobody asks, how long, how hard have you tried, how many trial have you done, if this really the best model that is possible from the data?
And imagine the cost of the data collection including the lab analytics!
And behind this costs, have you really tried hard enough to get the best out of your data? Was the calibration done quick and dirty on a Friday afternoon? Yes, time is limited and manually clicking around and wait in such kind of software is not really fun, so what are the consequences?
Now I come to the most important core point ever, if you own expensive NIR spectrometer system, or even many of them, and your company has collected a lot of NIR spectra and expensive Lab-reference data over years, do you spend just a few hours to develop and build that model, that will define the whole system's measurement performance for the future? And ask yourself again (and your boss will ask you later), have you really tried hard enough, to get the best out of your data? really?
What else is possible? What does your competition do?
There is no measure (yet) what can be reached with a specific NIR data set.
And this is very interesting, because there are different beliefs if a secondary method like NIR or Raman can be more precise and accurate, as the primary method.
What we do different is, that our highly specialized software is capable of creating large amounts of useful calibrations to investigate this limits – what is possible. It's done by permutation and combination of spectra-selection, wave-selection, pre-processing sequences and PC selections. If you are common with this, then you know that the possibilities are huge.
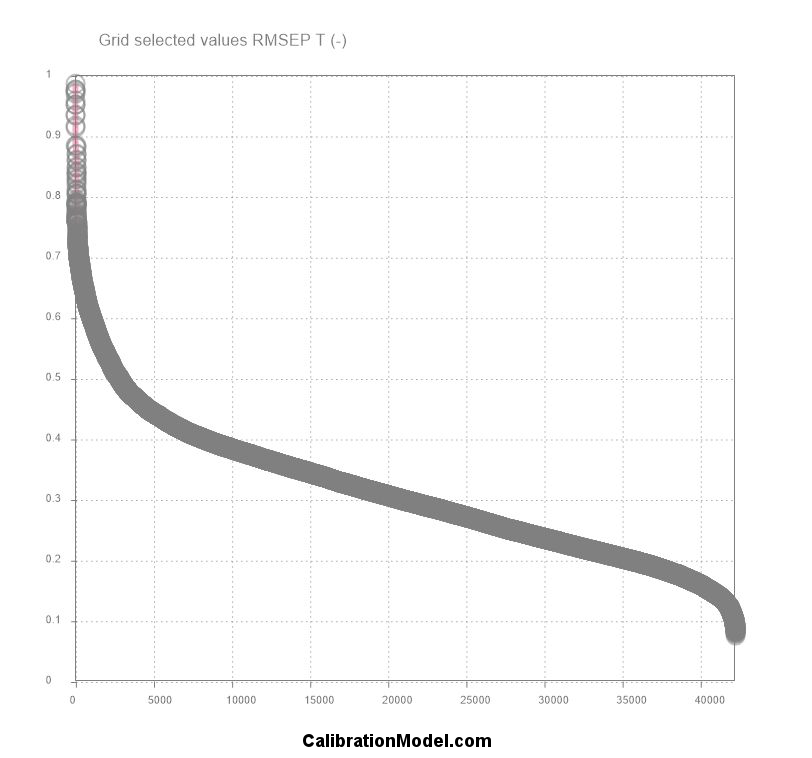
For a pre-screening, we create e.g. 42'000 useful calibrations for the mentioned data set. With useful we mean that the model is usable, e.g. R² is higher than 0.8, which shows a good correlation between the spectra and the constituent and it is well fitted (neither over-fitted nor under-fitted) because the PC selection for the calibration-set is estimated by the validation-set and the predictive performance of the test-set is used for model comparisons.
Here the sorted RMSEP values of the Test Set is shown for 42'000 calibrations.
You can immediately see that the manually found performance of 0.49 is just in the starting phase of our optimization. Interesting is the steep fall from 1.0 to 0.5 where manually optimization found it's solutions. A range where ca. 2500 different useful calibrations exist. The following less steep fall from 0.5 to 0.2 contains a lot more useful models and between 0.2 to 0.08 the obvious high accurate models are around 2500 different ones. So the golden needle is not in the first 2500 models, it must be somewhere in the last 2500 models in the haystack.
That allows us to pick the best calibration out of 42'000 models, depending on multiple statistical evaluation criteria, that is not just the R² or RPD, SEC, SEP or RMSEP, (or Akaike Information Criterion (AIC), Bayesian Information Criterion (BIC), Multivariate AIC (MAIC) etc.) we do the model selection based on multiple statistical parameters.
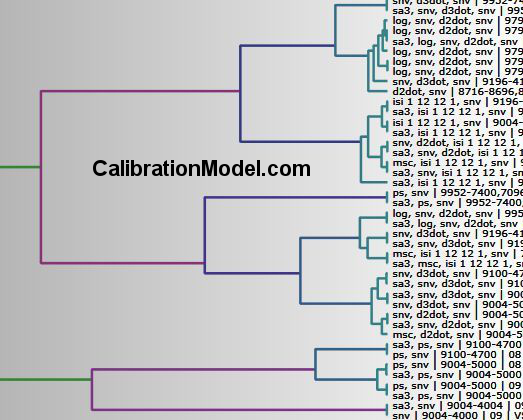
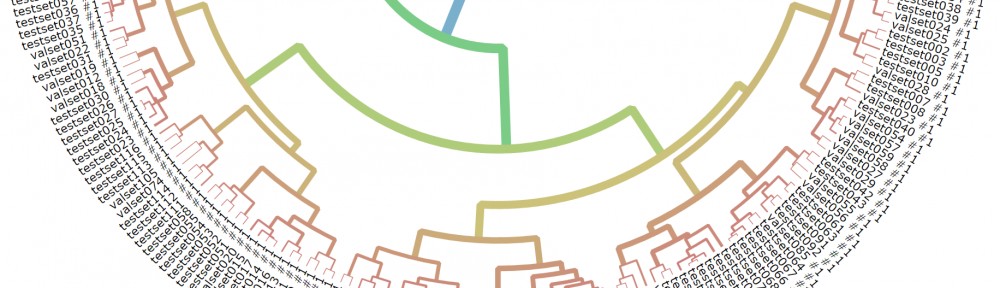
To compare the calibration models by similarity it is best viewed with dendrogram plots like this (zoomed in), where the settings are shown versus the models overall performance similarity. In the settings you can see a lot of different permutations of pre-processings combined with different wave-selections.
To give you an insight what we do to find the optimal model, imagine a NIR data set, where a NIR specialist works hard for 4 hours in his chemometric software to try what he can with his chemometric-, NIR spectroscopic- and his product-knowledge to get a good model. During the 4 hours he finds 3 final candidate models for his application. With the RMSEP of 0.49 , 0.51 and 0.6. Now he has to choose one or to test all his three models on new measured NIR spectra.
That is common practice. But is this good practice?
And nobody asks, how long, how hard have you tried, how many trial have you done, if this really the best model that is possible from the data?
And imagine the cost of the data collection including the lab analytics!
And behind this costs, have you really tried hard enough to get the best out of your data? Was the calibration done quick and dirty on a Friday afternoon? Yes, time is limited and manually clicking around and wait in such kind of software is not really fun, so what are the consequences?
Now I come to the most important core point ever, if you own expensive NIR spectrometer system, or even many of them, and your company has collected a lot of NIR spectra and expensive Lab-reference data over years, do you spend just a few hours to develop and build that model, that will define the whole system's measurement performance for the future? And ask yourself again (and your boss will ask you later), have you really tried hard enough, to get the best out of your data? really?
What else is possible? What does your competition do?
There is no measure (yet) what can be reached with a specific NIR data set.
And this is very interesting, because there are different beliefs if a secondary method like NIR or Raman can be more precise and accurate, as the primary method.
What we do different is, that our highly specialized software is capable of creating large amounts of useful calibrations to investigate this limits – what is possible. It's done by permutation and combination of spectra-selection, wave-selection, pre-processing sequences and PC selections. If you are common with this, then you know that the possibilities are huge.
For a pre-screening, we create e.g. 42'000 useful calibrations for the mentioned data set. With useful we mean that the model is usable, e.g. R² is higher than 0.8, which shows a good correlation between the spectra and the constituent and it is well fitted (neither over-fitted nor under-fitted) because the PC selection for the calibration-set is estimated by the validation-set and the predictive performance of the test-set is used for model comparisons.
Here the sorted RMSEP values of the Test Set is shown for 42'000 calibrations.
You can immediately see that the manually found performance of 0.49 is just in the starting phase of our optimization. Interesting is the steep fall from 1.0 to 0.5 where manually optimization found it's solutions. A range where ca. 2500 different useful calibrations exist. The following less steep fall from 0.5 to 0.2 contains a lot more useful models and between 0.2 to 0.08 the obvious high accurate models are around 2500 different ones. So the golden needle is not in the first 2500 models, it must be somewhere in the last 2500 models in the haystack.
That allows us to pick the best calibration out of 42'000 models, depending on multiple statistical evaluation criteria, that is not just the R² or RPD, SEC, SEP or RMSEP, (or Akaike Information Criterion (AIC), Bayesian Information Criterion (BIC), Multivariate AIC (MAIC) etc.) we do the model selection based on multiple statistical parameters.
To compare the calibration models by similarity it is best viewed with dendrogram plots like this (zoomed in), where the settings are shown versus the models overall performance similarity. In the settings you can see a lot of different permutations of pre-processings combined with different wave-selections.
That is common practice. But is this good practice?
And nobody asks, how long, how hard have you tried, how many trial have you done, if this really the best model that is possible from the data?
And imagine the cost of the data collection including the lab analytics!
And behind this costs, have you really tried hard enough to get the best out of your data? Was the calibration done quick and dirty on a Friday afternoon? Yes, time is limited and manually clicking around and wait in such kind of software is not really fun, so what are the consequences?
Now I come to the most important core point ever, if you own expensive NIR spectrometer system, or even many of them, and your company has collected a lot of NIR spectra and expensive Lab-reference data over years, do you spend just a few hours to develop and build that model, that will define the whole system's measurement performance for the future? And ask yourself again (and your boss will ask you later), have you really tried hard enough, to get the best out of your data? really?
What else is possible? What does your competition do?
There is no measure (yet) what can be reached with a specific NIR data set.
And this is very interesting, because there are different beliefs if a secondary method like NIR or Raman can be more precise and accurate, as the primary method.
What we do different is, that our highly specialized software is capable of creating large amounts of useful calibrations to investigate this limits – what is possible. It's done by permutation and combination of spectra-selection, wave-selection, pre-processing sequences and PC selections. If you are common with this, then you know that the possibilities are huge.
For a pre-screening, we create e.g. 42'000 useful calibrations for the mentioned data set. With useful we mean that the model is usable, e.g. R² is higher than 0.8, which shows a good correlation between the spectra and the constituent and it is well fitted (neither over-fitted nor under-fitted) because the PC selection for the calibration-set is estimated by the validation-set and the predictive performance of the test-set is used for model comparisons.
Here the sorted RMSEP values of the Test Set is shown for 42'000 calibrations.
You can immediately see that the manually found performance of 0.49 is just in the starting phase of our optimization. Interesting is the steep fall from 1.0 to 0.5 where manually optimization found it's solutions. A range where ca. 2500 different useful calibrations exist. The following less steep fall from 0.5 to 0.2 contains a lot more useful models and between 0.2 to 0.08 the obvious high accurate models are around 2500 different ones. So the golden needle is not in the first 2500 models, it must be somewhere in the last 2500 models in the haystack.

That allows us to pick the best calibration out of 42'000 models, depending on multiple statistical evaluation criteria, that is not just the R² or RPD, SEC, SEP or RMSEP, (or Akaike Information Criterion (AIC), Bayesian Information Criterion (BIC), Multivariate AIC (MAIC) etc.) we do the model selection based on multiple statistical parameters.

To compare the calibration models by similarity it is best viewed with dendrogram plots like this (zoomed in), where the settings are shown versus the models overall performance similarity. In the settings you can see a lot of different permutations of pre-processings combined with different wave-selections.
To give you an insight what we do to find the optimal model, imagine a NIR data set, where a NIR specialist works hard for 4 hours in his chemometric software to try what he can with his chemometric-, NIR spectroscopic- and his product-knowledge to get a good model. During the 4 hours he finds 3 final candidate models for his application. With the RMSEP of 0.49 , 0.51 and 0.6. Now he has to choose one or to test all his three models on new measured NIR spectra.
That is common practice. But is this good practice?
And nobody asks, how long, how hard have you tried, how many trial have you done, if this really the best model that is possible from the data?
And imagine the cost of the data collection including the lab analytics!
And behind this costs, have you really tried hard enough to get the best out of your data? Was the calibration done quick and dirty on a Friday afternoon? Yes, time is limited and manually clicking around and wait in such kind of software is not really fun, so what are the consequences?
Now I come to the most important core point ever, if you own expensive NIR spectrometer system, or even many of them, and your company has collected a lot of NIR spectra and expensive Lab-reference data over years, do you spend just a few hours to develop and build that model, that will define the whole system's measurement performance for the future? And ask yourself again (and your boss will ask you later), have you really tried hard enough, to get the best out of your data? really?
What else is possible? What does your competition do?
There is no measure (yet) what can be reached with a specific NIR data set.
And this is very interesting, because there are different beliefs if a secondary method like NIR or Raman can be more precise and accurate, as the primary method.
What we do different is, that our highly specialized software is capable of creating large amounts of useful calibrations to investigate this limits – what is possible. It's done by permutation and combination of spectra-selection, wave-selection, pre-processing sequences and PC selections. If you are common with this, then you know that the possibilities are huge.
For a pre-screening, we create e.g. 42'000 useful calibrations for the mentioned data set. With useful we mean that the model is usable, e.g. R² is higher than 0.8, which shows a good correlation between the spectra and the constituent and it is well fitted (neither over-fitted nor under-fitted) because the PC selection for the calibration-set is estimated by the validation-set and the predictive performance of the test-set is used for model comparisons.
Here the sorted RMSEP values of the Test Set is shown for 42'000 calibrations.
You can immediately see that the manually found performance of 0.49 is just in the starting phase of our optimization. Interesting is the steep fall from 1.0 to 0.5 where manually optimization found it's solutions. A range where ca. 2500 different useful calibrations exist. The following less steep fall from 0.5 to 0.2 contains a lot more useful models and between 0.2 to 0.08 the obvious high accurate models are around 2500 different ones. So the golden needle is not in the first 2500 models, it must be somewhere in the last 2500 models in the haystack.
That allows us to pick the best calibration out of 42'000 models, depending on multiple statistical evaluation criteria, that is not just the R² or RPD, SEC, SEP or RMSEP, (or Akaike Information Criterion (AIC), Bayesian Information Criterion (BIC), Multivariate AIC (MAIC) etc.) we do the model selection based on multiple statistical parameters.
To compare the calibration models by similarity it is best viewed with dendrogram plots like this (zoomed in), where the settings are shown versus the models overall performance similarity. In the settings you can see a lot of different permutations of pre-processings combined with different wave-selections.
UniquenessEinzigartigkeitUniqueness
Proof of Concept and WorkProof of Concept and WorkProof of Concept and Work
In 2021 we automatically calibrated Mango DM with RMSEP = 0.7247 with our software
that performs better than the one in an research paper that states :
Chemometric software competitions (aka shootouts) are a good way to check algorithms, software and knowledge against all other experts in the field.
Imagine that the prediction results can be produced with any kind of software and newest algorithms.
And we just use PLS right to generate models that can be used on all NIR software systems, because PLS is a quasi standard, supported in all major chemometrics software.
Our software framework reached very good results, got gold (rank #1) and silver (rank #2) during well known international NIR Chemometric software shootouts* so far, the competitions are held bi-annual.
The Kaji Competition
The IDRC Competition
*) The author was unable to present the results at the conferences, so this ranking was not official but confirmed by the shootout organizers. Thanks go to Benoit Igne, IDRC 2012 shootout organizer and Steve Holroyd, Kaji Competition organizer at ANISG Conference 2012.
Conclusion
Our chemometric software framework can significantly reduce the time spent for NIR method development and fine optimization. The time saving can be achieved through highly automated experiments and the usage of cloud computing. Calibrations are built and evaluated using automated good practices protocols resulting in useful, precise and robust Calibrations. The high number of experiments enables a deep screening of the solution domain to find the optimum calibration settings, something currently unavailable in standard chemometric software.
**) We were the only participator that got the 4 competition tasks (4-times more than usual) completed in that short time and submitted the fully documented results. After the competition, the information was given, that the data was originated from forages and the constituents were dry matter, organic matter digestibility, protein and ash. Thanks go to Daniel Cozzolino, Kaji 2014 Competition organizer.
that performs better than the one in an research paper that states :
- “Readers are encouraged to use this big data set and produce innovative ideas and algorithms to achieve RMSEP better than 0.79%.”
Chemometric software competitions (aka shootouts) are a good way to check algorithms, software and knowledge against all other experts in the field.
Imagine that the prediction results can be produced with any kind of software and newest algorithms.
And we just use PLS right to generate models that can be used on all NIR software systems, because PLS is a quasi standard, supported in all major chemometrics software.
Our software framework reached very good results, got gold (rank #1) and silver (rank #2) during well known international NIR Chemometric software shootouts* so far, the competitions are held bi-annual.
| Rank / competitors | Competition / Conference | Year |
| #1 / 1 ** | Kaji / ANSIG | 2014 |
| #1 / 150 | Kaji / ANSIG | 2012 |
| #2 / ??? | IDRC / IDRC | 2012 |
A set of NIR spectral data will be available for downloading from the ANISG website and contestants will be asked to find and explain a "best" chemometric model to robustly predict samples of the same type.
A panel will select the three "best" entries based on the predicted results and spectroscopic explanation of the products and attributes of interest.
http://www.anisg.com.au/the-kaji-competition
The IDRC Competition
The Software Shootout has been a staple of the IDRC. It is a competition amongst participants of the conference that aims at determining the person who developed the best model and obtained the lowest prediction error for a particular problem.
Every IDRC, a new challenge is proposed to participants. The challenge consists of a data set with calibration, test and a validation set.
Participants are given target values for the calibration and test sets but must do their best to develop a model that will predict the validation set as accurately and precisely as possible. Challenges from all sorts of fields of NIRS have been used (agriculture, biomedical, pharmaceutical, soil, …).
IDRC
*) The author was unable to present the results at the conferences, so this ranking was not official but confirmed by the shootout organizers. Thanks go to Benoit Igne, IDRC 2012 shootout organizer and Steve Holroyd, Kaji Competition organizer at ANISG Conference 2012.
Conclusion
Our chemometric software framework can significantly reduce the time spent for NIR method development and fine optimization. The time saving can be achieved through highly automated experiments and the usage of cloud computing. Calibrations are built and evaluated using automated good practices protocols resulting in useful, precise and robust Calibrations. The high number of experiments enables a deep screening of the solution domain to find the optimum calibration settings, something currently unavailable in standard chemometric software.
**) We were the only participator that got the 4 competition tasks (4-times more than usual) completed in that short time and submitted the fully documented results. After the competition, the information was given, that the data was originated from forages and the constituents were dry matter, organic matter digestibility, protein and ash. Thanks go to Daniel Cozzolino, Kaji 2014 Competition organizer.
In 2021 we automatically calibrated Mango DM with RMSEP = 0.7247 with our software
that performs better than the one in an research paper that states :
- “Readers are encouraged to use this big data set and produce innovative ideas and algorithms to achieve RMSEP better than 0.79%.”
Chemometric software competitions (aka shootouts) are a good way to check algorithms, software and knowledge against all other experts in the field.
Imagine that the prediction results can be produced with any kind of software and newest algorithms.
And we just use PLS right to generate models that can be used on all NIR software systems, because PLS is a quasi standard, supported in all major chemometrics software.
Our software framework reached very good results, got gold (rank #1) and silver (rank #2) during well known international NIR Chemometric software shootouts* so far, the competitions are held bi-annual.
| Rank / competitors | Competition / Conference | Year |
| #1 / 1 ** | Kaji / ANSIG | 2014 |
| #1 / 150 | Kaji / ANSIG | 2012 |
| #2 / ??? | IDRC / IDRC | 2012 |
A set of NIR spectral data will be available for downloading from the ANISG website and contestants will be asked to find and explain a "best" chemometric model to robustly predict samples of the same type.
A panel will select the three "best" entries based on the predicted results and spectroscopic explanation of the products and attributes of interest.
http://www.anisg.com.au/the-kaji-competition
The IDRC Competition
The Software Shootout has been a staple of the IDRC. It is a competition amongst participants of the conference that aims at determining the person who developed the best model and obtained the lowest prediction error for a particular problem.
Every IDRC, a new challenge is proposed to participants. The challenge consists of a data set with calibration, test and a validation set.
Participants are given target values for the calibration and test sets but must do their best to develop a model that will predict the validation set as accurately and precisely as possible. Challenges from all sorts of fields of NIRS have been used (agriculture, biomedical, pharmaceutical, soil, …).
IDRC
*) The author was unable to present the results at the conferences, so this ranking was not official but confirmed by the shootout organizers. Thanks go to Benoit Igne, IDRC 2012 shootout organizer and Steve Holroyd, Kaji Competition organizer at ANISG Conference 2012.
Conclusion
Our chemometric software framework can significantly reduce the time spent for NIR method development and fine optimization. The time saving can be achieved through highly automated experiments and the usage of cloud computing. Calibrations are built and evaluated using automated good practices protocols resulting in useful, precise and robust Calibrations. The high number of experiments enables a deep screening of the solution domain to find the optimum calibration settings, something currently unavailable in standard chemometric software.
**) We were the only participator that got the 4 competition tasks (4-times more than usual) completed in that short time and submitted the fully documented results. After the competition, the information was given, that the data was originated from forages and the constituents were dry matter, organic matter digestibility, protein and ash. Thanks go to Daniel Cozzolino, Kaji 2014 Competition organizer.
Recent advanced chemometric methodsNeueste weiterentwickelte chemometrische Methoden
You are searching for recent advanced chemometric methods to get better calibration models for NIR?
Methods and algorithms like:
- Artificial Neural Networks (ANN)
- General Regression Neural Networks (GR-NN)
- RBF Neural Networks (RBF-NN)
- Support Vector Machines (SVM)
- Multiway Partial Least Squares (MPLS),
- Orthogonal PLS (OPLS), (O-PLS), OPLS-AA, OPLS-ANN
- R-PLS, UVE-PLS, RUVE-PLS, LOCAL PLS
- Hierarchical Kernel Partial Least Squares (HKPLS)
- Random Forest (RF)
- etc.
- Extended Multiplicative Signal Correction (EMSC)
- Orthogonal Signal Correction (OSC)
- Dynamic Orthogonal Projection (DOP)
- Error Removal by Orthogonal Subtraction (EROS)
- External Parameter Orthogonalization (EPO)
- etc.
- Künstliche Neuronale Netze (KNN, ANN)
- Allgemeine Regression Neural Networks (GR-NN)
- RBF Neuronale Netze (RBF-NN)
- Support Vector Machines (SVM)
- Multiway Partial Least Squares (MPLS)
- Orthogonale PLS (OPLS), (O-PLS), OPLS-AA, OPLS-ANN
- R-PLS, UVE-PLS, Rüve-PLS, PLS LOCAL
- Hierarchische Kernel Partial Least Squares (HKPLS)
- Random Forest (RF)
- usw.
- Erweiterte Multiplikative Signal Correction (EMSC)
- Orthogonale Signal Correction (OSC)
- Dynamische orthogonale Projektion (DOP)
- Fehlerbeseitigung durch orthogonale Subtraktion (EROS)
- Externe Parameter Orthogonalisierung (EPA)
- usw.
BenefitNutzenBenefici
The NIR Calibration service offers the following benefit:
Saving money
- Improving the accuracy and reliability of already used NIR calibration models have high potential in various manufacturing processes as well as in quality assurance.
- increased accuracy of analysis => better control of the production process => optimum process flow => better quality => less waste => more throughput.
- quick and inexpensive to create professional NIR calibration models.
- relief of their own staff
- for data cleaning (increasing data quality) - missing data, outlier search, wrong data (conflicting information), outlier removal
- for the search for the optimal NIR model parameter settings (calibration set, wavelength selection, data pretreatments, factor selection)
- for the calculation of different variations of the model
- for the validation, evaluation and selection of the optimal model (error, SEP, RMSEP, RMSEC, RPD, fit, R2, bias, slope, ...)
- time-consuming calculation of huge calibration models
- no long trial and error and waiting in the used NIR software until the calibrations seems to work
- higher reliability due to accuracy and robustness of NIR calibration models
- the possibility of comparison with your own created or already existing or purchased NIR calibrations
- what performance increase of analytical accuracy is possible
- improvement of robustness with respect to change of the product matrix and possible instruments drift
- decades of experience in chemometrics for NIR spectroscopy
- based on theoretical and applied good practice and know-how
- application of various guidelines and rules
- application of vendor-independent NIR chemometric software
- outsourcing of NIR calibration method development and calibration equation maintenance
- improving the robustness of NIR prediction model
- avoid traps and pitfalls of the complicated chemometrics
- The service provides optimal calibration settings for your NIR data.
- You get full insight into the NIR calibration, as it is produced and detailed statistical values as a performance index assisted with graphics.
- Die Verbesserung der Genauigkeit und Zuverlässigkeit bereits eingesetzter/angewandter NIR Kalibrationsmodelle hat hohes Einsparpotenzial bei verschiedenen Produktions Prozessen wie auch in der Qualitätssicherung.
- Erhöhte Analysen Genauigkeit => den Produktionsprozess besser im Griff => optimaler Prozessablauf => bessere Qualität => weniger Ausschuss => mehr Durchsatz
- Schnell und günstig professionelle NIR Kalibrations Modelle erstellen.
- Entlasten von eigenem Personal
- beim Datenbereinigung (Steigerung der Datenqualität) - Fehlende Daten, Ausreisser Erkennung, fehlerhafte Daten (widersprüchliche Informationen), Ausreisser Elimination
- beim Suchen nach den optimalen Parameter Kombinationen für das Modell (calibration set, wavelength selection, data pretreatments, factor selection)
- beim zeitintensiven Berechnungen von diversen Variationen des Modells
- bei der Validation, Bewertung und Auswahl des optimalen Modells (error, SEP, RMSEP, RMSEC, RPD, fit, R2, bias, slope, ...)
- Nicht lange rumprobieren in der verwendeten NIR Software bis die Kalibration einigermassen funktioniert.
- höhere Zuverlässigkeit durch Genauigkeit und Robustheit der NIR Kalibrations Modelle
- Vergleichsmöglichkeit mit ihren eigenen erstellten oder schon vorhandenen oder gekauften NIR Kalibrationen
- was ist an Performance Steigerung der Analysen Genauigkeit möglich
- was ist an Robustheit bzgl. ändernder Produkt Matrix, Instrumenten Drift möglich
- Jahrzehnte lange Erfahrung in Chemometrics for NIR-Spectroscopy
- basierend auf theoretischer und angewandter Good Practice und Know How
- Anwendung verschiedenster Richtlinien und Regeln
- Anwendung von Hersteller unabhängiger NIR Chemometrie Software
- Auslagerung (Outsourcing) der NIR-Kalibrations Methoden Entwicklung und NIR Kalibrations Pflege
- Verbesserung der Robustheit von NIR-Kalibrationen
- Vermeidung von Fallstricken und Fallgruben der komplexen Chemometrie
- Der Service liefert die optimalen Kalibrations Einstellungen für ihre NIR Daten.
- Sie erhalten vollen Einblick in die NIR Kalibration, wie sie erzeugt wird und detaillierte statistische Werte als Performance Übersicht unterstützt mit Grafiken.
- Migliorando la precisione e l’affidabilità di modelli di calibrazione NIR pre-esistenti si possono aumentare le potenzialità in vari processi di produzione, nonché la garanzia di qualità.
- Maggiore accuratezza dell’analisi assicura un miglior controllo del processo produttivo, flusso di processo ottimale e meno scarti di produzione.
- Velocità e poco costo per creare modelli di calibrazione professionali.
- Sollievo del personale.
- Ripulendo i dati e aumentandone la qualità – dati mancanti, ricerca di valori anomali, dati errati (informazioni contraddittorie), rimozione di valori anomali.
- Ricercando impostazioni ottimali dei parametri del modello NIR (set di calibrazione, selezione lunghezza d'onda, pre-trattamentidi dati, selezione fattore).
- Calcolando diverse varianti del modello.
- Facendo valutazioni di convalida e selezione del modello ottimale (errore, SEP, RMSEP, RMSEC, RPD, fit, R2, bias, slope, ...).
- Per il calcolo dei modelli di calibrazioni enormi.
- Maggiore affidabilità grazie alla precisione e robustezza dei modelli di calibrazione NIR.
- Possibilità di confronto del metodo creato e quello eventualmente da acquistare.
- Aumento della performance di accuratezza analitica quanto possibile.
- Miglioramento della robustezza cambiando matrice e possibile derivata.
- Decenni di esperienza nella chemiometria per la spettroscopia NIR.
- Su base teorica e applicata di buone tecniche e know-how.
- Applicazione di linee guida.
- Presenza di venditori indipendenti di software chemiometrici NIR.
- Manutenzione equazione di taratura.
- Migliorare la solidità del modello di predizione NIR.
- Evitare trappole e trabocchetti della complicata chemiometria.
- Il servizio fornisce le impostazioni di calibrazione ottimali per i vostri dati NIR.
- È possibile avere una piena conoscenza della calibrazione NIR, in quanto vengono forniti in modo dettagliato valori statistici come indice di performance assistita e relativi grafici.